Journal of Pharmacokinetics and Pharmacodynamics, Vol. 32, No. 2, April 2005 ( 2005)DOI: 10.1007/s10928-005-0074-7
How Modeling and Simulation Have Enhanced Decision Making in New Drug Development Raymond Miller,1,∗ Wayne Ewy,1 Brian W. Corrigan,1 Daniele Ouellet,1 David Hermann,1 Kenneth G. Kowalski,1 Peter Lockwood,1 Jeffrey R. Koup,1 Sean Donevan,1 Ayman El-Kattan,1 Cheryl SW Li,1 John L. Werth,1 Douglas E. Feltner,1 and Richard L. Lalonde1
Received June 30, 2005—Final July 28, 2005
The idea of model-based drug development championed by Lewis Sheiner, in which pharma-costatistical models of drug efficacy and safety are developed from preclinical and availableclinical data, offers a quantitative approach to improving drug development and develop-ment decision-making. Examples are presented that support this paradigm. The first exam-ple describes a preclinical model of behavioral activity to predict potency and time-courseof response in humans and assess the potential for differentiation between compounds. Thisexample illustrates how modeling procedures expounded by Lewis Sheiner provided the meansto differentiate potency and the lag time between drug exposure and response and allow forrapid decision making and dose selection. The second example involves planning a Phase 2adose-ranging and proof of concept trial in Alzheimer’s disease (AD). The issue was how toproceed with the study and what criteria to use for a go/no go decision. The combined knowl-edge of AD disease progression, and preclinical and clinical information about the drug wereused to simulate various clinical trial scenarios to identify an efficient and effective Phase2 study. A design was selected and carried out resulting in a number of important learningexperiences as well as extensive financial savings. The motivation for this case in point wasthe “Learn-Confirm” paradigm described by Lewis Sheiner. The final example describes theuse of Pharmacokinetic and Pharmacodynamic (PK/PD) modeling and simulation to confirmefficacy across doses. In the New Drug Application for gabapentin, data from two adequateand well-controlled clinical trials was submitted to the Food and Drug Administration (FDA)in support of the approval of the indication for the treatment of post-herpetic neuralgia. Theclinical trial data was not replicated for each of the sought dose levels in the drug applica-tion presenting a regulatory dilemma. Exposure response analysis submitted in the New DrugApplication was applied to confirm the evidence of efficacy across these dose levels. Modelingand simulation analyses showed that the two studies corroborate each other with respect to
1Pfizer Global Research and Development, Pfizer Inc, 2800 Plymouth Road, Ann Arbor,
*To whom correspondence should be addressed. Telephone: +1-734-6222373; e-mail:
1567-567X/05/0400-0185/0 2005 Springer Science+Business Media, Inc. Miller et al. the pain relief profiles. The use of PK/PD information confirmed evidence of efficacy acrossthe three studied doses, eliminating the need for additional clinical trials and thus supportingthe approval of the product. It can be speculated that the work by Lewis Sheiner reflectedin the FDA document titled “Innovation or Stagnation: Challenge and Opportunity on theCritical Path to New Medical Products” made this scientific approach to the drug approvalprocess possible.KEY WORDS: drug development; pharmacokinetics; pharmacodynamics; PK/PD; simula- tion. INTRODUCTION
Materia medica is a Latin term for any material or substance used in
the composition of curative agents in medicine. The use of materia med-ica was historically based upon the idea that medicines possess magicalcurative powers. Folk healers among the peasantry believed in the law ofsignatures to identify which herbs would be effective against which dis-eases. By a process of trial and error, folk healers learned which herbsworked and which herbs did not work. Materia medica eventually devel-oped into the science of pharmacology. The subject of pharmacology hasgrown rapidly in recent years and new drugs are being synthesized at anever-increasing rate. Clinical pharmacology has been described as a bridg-ing discipline that combines elements of pharmacology with clinical med-icine. In the past few decades drug development has progressed from therelatively ad hoc trial and error process of materia medica to an advancedscientific process involving careful experimental design, valid data analysis,informative graphics, mathematical modeling, and computer science. LewisSheiner (1940–2004) was one of the pivotal individuals in this changingevolution. Through his scientific writings, teaching programs, and collab-oration with scientists around the world, his impact on drug develop-ment has been immeasurable. His philosophy of “Learn, confirm” cyclesthroughout drug development has become the catchphrase in the field ofclinical pharmacology (1). Regulatory bodies have come to realize thatproof of efficacy is only one step in a long process from drug discov-ery to marketing. This is reflected in the most recent guideline that theFood and Drug Administration (FDA) has published:– “Innovation orStagnation: Challenge and Opportunity on the Critical Path to New Med-ical Products” (2). The FDA has emphasized the importance of integrat-ing pharmacokinetic and pharmacodynamic (PK/PD) information in drugdevelopment and its potential impact on decision-making. This manu-script describes three real examples where the application of modeling andsimulation techniques, as suggested by Lewis Sheiner, aided drug develop-ment at critical decision points in preclinical development, phase 2 andregulatory review. Modeling and Simulation in New Drug Development EARLY DRUG DEVELOPMENT
The major objectives of early drug development are to select prom-
ising compounds and to identify potentially safe and effective doses anddosing regimens. Integration of PK/PD in early development helps withcompound selection and guides creation of an efficient clinical develop-ment strategy.
This first example illustrates the application of PK/PD modeling in
predicting response in a Phase 1 study and assessing the potential fordifferentiation between compounds. Three compounds of the same class(A, B, and C) were being investigated for the same indication and wereat different stages in their development. These compounds were centrallyactive and speed of onset was a crucial determinant of efficacy. Thus,differences in both potency and time course of effect were important inidentifying the most efficacious dose. The drug development strategy wasto accelerate development of back-up compounds by capitalizing on pre-vious information from compounds further along in the development andto advance the lead compound unless backups were clearly differentiablybetter. Compound C was the last in the series, but had the potential to bea superior candidate.
Dose-ranging preclinical pharmacology studies using similar designs
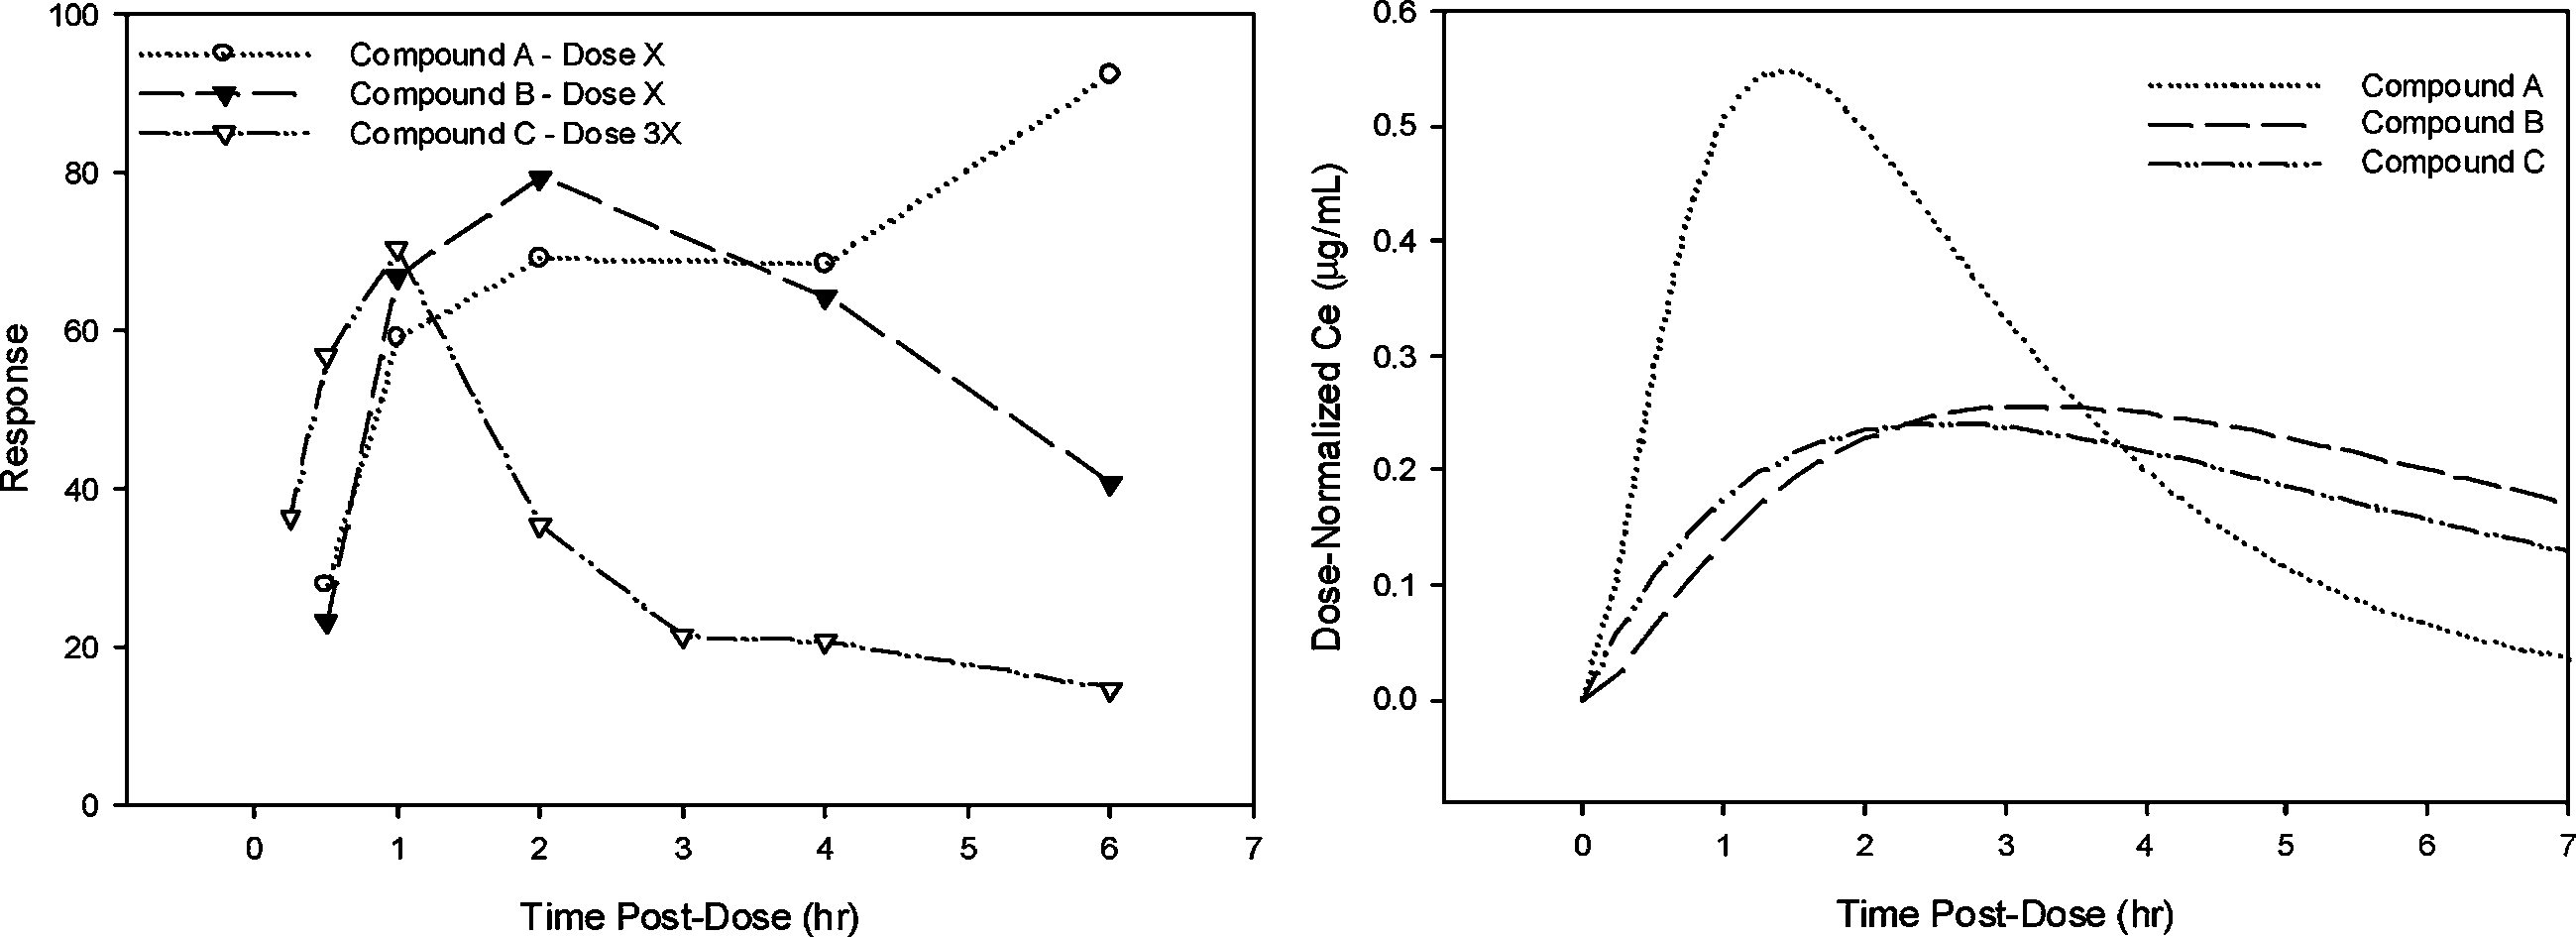
were conducted assessing response at scheduled times post administrationof each compound. In addition to measuring pharmacologic response, anobjective of these studies was to understand the pharmacokinetic (PK) pro-file. Thus, PK samples were obtained in a parallel group of animals. Com-pounds A, B, and C differ only slightly in terms of PK properties. However,they had different potency and quite different time courses of pharmaco-logic response after a single dose, with a delay in onset of pharmacologicactivity relative to the PK profile. Figure 1 illustrates the time course of
Fig. 1. Time course of pharmacologic response in preclinical studies (Left Panel) and Dose-Normalized concentrations in the effect site (Right Panel) for compounds A, B and C. Miller et al.
pharmacodynamic response for compounds A, B and C. Note that the meanresponse at 6 hr for compound A was not consistent with the rest of the data,however, this pattern was not observed at other dose levels, and did notadversely impact pharmacodynamic parameter estimates obtained by simul-taneously fitting data from all dose levels. The relationship between con-centration and response was assessed using the classical approach describedby Sheiner et al. (3) popularly known as the “effect compartment model”. This seminal work made it practical to quantify the lag between the expo-sure to a drug and the onset and offset of the pharmacologic response. ThePK/PD modeling was conducted in NONMEM version V (4) using individ-ualized PK parameters to determine potency of each compound (EC50) andthe delay between peak concentration and effect as described using effectsite equilibration rate constant (ke0). Results of the PK/PD modeling aresummarized in Table I and predicted effect-concentration-time profiles illus-trated in Fig. 1. The temporal delay observed between systemic concentra-tions and pharmacodynamic response may be related to slow distribution tothe site of action, post-receptor mechanisms or other physiological processesinvolved in generating the measured response. At this stage of developmentquantifying the delay was adequate for comparing the compounds.
Thus, in terms of potency, the compounds rank from highest to low-
est as follows: B > A > C with potency relative to A of 0.3 for B and 4for C. The compounds ranked as C > A > B, starting with the most rapidonset, with ke0 relative to A of 12 for C and 0.7 for B. From these pre-clinical results, a model was developed to simulate the response profile inhumans for compound C. The PK predictions were made based on allo-metric scaling of the PK parameters of systemic clearance and volume ofdistribution, estimates of absorption rate constant and assuming a similarlag time of absorption. For the pharmacodynamic parameters, ke0 was heldconstant from the preclinical data, while ED50 was adjusted based on the
Table I. Parameter Estimates of the PK-PD Modeling of Preclinical Modeling and Simulation in New Drug Development Fig. 2. Time course of pharmacologic response in Phase 1 study (Left Panel) and Dose-
Normalized concentrations in the effect site (Right Panel) for compounds A, B and C.
potency ratios in Table I. A sigmoid Emax model has been developed basedon data obtained following administration of compound A in healthy sub-jects (Fig. 2). Parameters of the pharmacodynamic model such as baseline,Emax, and sigmoidicity factor were assumed to be constant in making pre-dictions. Although compound B was more potent than C, development wasdiscontinued because of its slower onset and offset of action.
Results obtained in the single rising dose tolerance study in the subse-
quent clinical trial confirmed the simulation results (Fig. 2), showing thatthe relative potency and relative rate of onset determined in the preclinicalmodel were consistent with the clinical data (Table I). Compound C hadlower potency than predicted, but the rank order for potency and onsetrate was maintained. These parameters were adjusted based on Phase 1data and further used to predict doses in proof-of-concept studies.
The preclinical and clinical PK/PD models developed for compounds
A and B were used together with preclinical data for compound C to pre-dict the time course of pharmacologic activity in humans for compoundC. This allowed development of go/no go decision criteria based on onsettime observed in the first in human (FIH) study of compound C. ThePK/PD predictions then provided a rationale for greater investment incompound C to move it to the FIH decision point more quickly. Finally,PK/PD modeling of relative potency was useful for dose selection for theFIH study, and later, using also phase 2a information from compounds Aand B, for a phase 2a study of compound C.
The application of the so called “effect compartment model” approach
that Lewis Sheiner described to quantify the discontinuity frequently seenbetween exposure to a drug and the observed clinical response has hadenormous impact on the drug development discipline. Determination ofrelative potency, as measured by EC50, and relative rate of onset of phar-macologic action, as assessed using the parameter ke0, can be scaled from
Miller et al.
animal models to human and can be used to discriminate between com-pounds, saving considerable time and money that would otherwise beneeded for human trials. PHASE 2 DRUG DEVELOPMENT
Phase 2 proof of concept (POC) and dose-ranging trials in a select
group of patients are essential to verify that the compound demonstratessufficient efficacy and safety. At this stage it is important to character-ize the relationship between drug exposure and response, be it with arelevant biomarker or some clinical endpoint. Information that is gath-ered during this phase provides grounds for the decision of whether thebalance between efficacy and safety justifies investing in the much moreexpensive phase 3 program. Lewis Sheiner’s influential publication describ-ing the learn-confirm cycles that developers need to go through brilliantlydescribes this information gathering process (1). The procedure can bethought of as progressive cycles starting with learning in phase 1 aboutoptimal conditions to initiate phase 2, and learning from phase 2 to decidewhether or not to initiate phase 3 and the procedure that is most likely tomeet with success (i.e. correctly answer the questions). During phase 2 akey feature of this approach is to use previous clinical trial informationin the same disease with prior PK/PD information on the new compoundto better predict the most probable trial outcome. The following exampleapplies some of the principles championed by Lewis Sheiner and illustratesthe use of the lessons learned during the preclinical phase and phase 1,together with literature data to design a phase 2 study.
CI-1017 is an M1-muscarinic acid agonist for which we had PK/PD
information from Phase 1 and preclinical studies (5). The question facingthe drug development team was how to proceed with the Phase 2 studyand what criteria should be applied for a go/no-go decision based on itsresults. Traditionally, Alzheimer’s Disease (AD) trials used parallel group,placebo-controlled designs, assessing the Alzheimer’s Disease AssessmentScale-Cognitive Subscale (ADASCog) at 4, 6, or 8-week intervals over atrial duration of 12–30 weeks. In this instance, the availability of toxicol-ogy study results limited the total exposure to study drug to 12 weeks.
The drug development team decided to use the combined knowledge
about AD and CI-1017 to simulate various clinical trial scenarios to aidthe design of the first Phase 2 study. The trial was to answer severalquestions, three of which were most important. First, does the drug havebenefit? Second, since preclinical data implied a possible inverse U-shapedose-response, is more drug better than less? The shape of the exposure-response curve was an important issue since this would have a major
Modeling and Simulation in New Drug Development
impact on the dose selection and design to be used in the phase 3 study. In fact, if the exposure-response analysis did exhibit an inverse U-shape,this product might well be unmarketable. Finally, if the drug proved ben-eficial, an objective was to identify the target dose range for subsequenttrials. The design of the phase 2 trial, therefore, needed to focus on theexposure-response profile not just the question of whether the drug givesa beneficial effect.
At this stage a useful benchmark was tacrine (an approved drug for
the treatment of AD symptoms). Extensive in-house clinical trial data fortacrine was available as well as literature data describing the exposure-response relationship (6–8). The tacrine data together with phase 1 PKand preclinical data for CI-1017 were used to simulate various clinical trialscenarios to determine the optimal clinical trial design that would have thebest likelihood of answering the above questions.
Prospective designs included a conventional parallel group design and
three Latin Square (crossover) designs with different numbers of treat-ments and treatment durations. Each study was constrained to be aboutthe same size, with sixty patients and a total of about six ADASCog mea-surements per patient, since one design objective was to choose the bestdesign conditional on a specified level of investment. The intrinsic meritof the different designs was evaluated using two key metrics: (i) the per-centage of simulated trials that correctly detected a drug effect, using theappropriate analysis method and decision rule (this is essentially the con-ventional statistical power) and (ii) the percentage of simulated trials thatcorrectly identified the shape of the dose-response profile (monotonic orinverse U-shaped). Accuracy of target dose estimation was also assessed.
Because we were unsure of the form of the true exposure-response
relationship four different models were simulated: three monotonic mod-els (Emax [super-linear], linear, and sigmoid Emax [sublinear]) and oneinverse U-shaped model. Assuming a three-point effect as the minimallyacceptable profile (based on tacrine’s effect), each of these response mod-els were constructed to reach a maximum of three points in the testeddose range: at the highest dose for the monotonic models and at the “bestdose” for the inverted U-shaped model. The four drug effect models aredepicted in Fig. 3.
For each treatment sequence, a population of patients was created and
sampled with replacement to generate individual clinical trials (from 100 to2000 clinical trials depending upon the precision needed for the particularobjective). One objective of the simulations was to determine the relativerobustness of the designs to detect a significant (α = 0.05) treatment effectfor each of the assumed dose-response relationships. Table II reports thepower or percentage of trials in which a statistically significant treatment
Miller et al. Fig. 3. Hypothetical drug effect models used to assess robustness of the designs to various
assumptions for the CI-1017 dose-response relationship (from ref. 5). Table II. Estimated Power to Detect a Significant (α = 0.05)
effect was detected. The 4 × 4 Latin Square with four-week periods was themost robust design and performed well (>80% power) for all three mono-tonic dose-response relationships examined. Power was lower to detect theinverse U-shaped dose-response. The parallel group design (N = 60) did notperform well, confirming the original power calculations that hundreds ofpatients would be needed. Based on these results, a 4 × 4 design with four-week periods was recommended and ultimately conducted saving significantresources (in excess of two million dollars compared to a parallel group
Modeling and Simulation in New Drug Development
study with similar power), and the total elapsed conduct time was perhapseight months shorter because of the reduced enrollment burden. The statis-tical models were ready for a rapid analysis of the data after the completionof the study. In this case, the results failed to meet the predefined criteria,and the drug project was cleanly terminated without the need for endlessrework of the data looking for an elusive signal, as is often the case withnegative studies. Phase 3 and Beyond
Phase 3 clinical trials confirm the efficacy of new therapies as the final
step prior to submission to a regulatory body for approval. Based on the1962 amendment to the Federal Food, Drug and Cosmetic Act of 1938(9), regulators interpretation was that substantial evidence of effectivenessrequired at least two adequate and well-controlled (AWC) investigations,presumably to ensure that the findings are repeatable. The FDA Moderni-zation Act of 1997 and the FDA “effectiveness” guidance of 1998 (10,11)opened the door to using exposure-response information in combinationwith a single pivotal clinical trial as sufficient evidence of effectiveness. Although this situation may be relatively rare, there are much more com-mon situations for which exposure-response data can support registrationdecisions and labeling. The recent gabapentin sNDA approval for neuro-pathic pain is a good example. Gabapentin (Neurontin ) was originallyapproved in the U.S. in 1993 as adjunctive therapy in the treatment of par-tial seizures in patients with epilepsy. Post marketing, anecdotal evidencesuggested that patients suffering with post herpetic neuralgia (a syndromeof neuropathic pain following herpes zoster and occurring in approxi-mately 10–15% of all herpes zoster patients) may receive pain relief withgabapentin.
To support the marketing approval of gabapentin for the indication
of PHN, the sNDA package contained efficacy data from two trials con-ducted in patients with PHN. Unfortunately, these trials did not study thesame dose levels—patients in study 1 were randomized to a final dose of3600 mg/day while patients in study 2 were randomized either to 1800 or2400 mg/day. Thus there was not replicate data for efficacy at these doses. Understanding of the exposure-response for gabapentin in PHN was furthercomplicated by the saturable absorption of gabapentin, leading to less thandose proportional changes in exposure. The lack of replicated findings at asingle dose, coupled with the saturable absorption and nonlinear exposure,presented a unique regulatory hurdle to approval for the PHN indication.
An exposure-response (ER) analysis was completed and included with
the submission. Although ER concepts are not new, their value as part of
Miller et al.
regulatory submissions has changed. ER evaluation took on a new rolewith the advent of FDAMA 1997 (10,11), which stated in Section 115that “ . . . based on relevant science, that data from one adequate and well-controlled clinical investigation and confirmatory evidence (obtained prior toor after such investigation) are sufficient to establish effectiveness. . . ”. Thismeans that instead of the conventional requirement of two AWC clinicaltrials to support a new drug application, the sponsor could rely on theresults of a single AWC clinical trial combined with confirmatory evidence(such as ER data). Since 1977, prior to the gabapentin case no approveddrug labeling has made use of this concept.
The gabapentin sNDA represented the first application of ER infor-
mation to establish a linkage across two pivotal clinical studies to provideconfirmatory evidence of dose response under the FDAMA ruling. Pop-ulation PK/PD analyses were submitted showing that gabapentin exhib-its exposure-dependent decreases in daily pain scores (Figs. 4 and 5) (12). In this analysis, the decrease in daily pain score was adequately describedby an Emax model expressed as change from baseline minus effect ofdrug (gabapentin dose corrected for estimated bioavailability) and time-dependent placebo effect, with gender and disease duration having min-imal effect on the ER relationship. Data from the titration period fromeach study were also successfully incorporated into the model to providemore information about within-subject dose response. The models and thesupporting data were all made readily available to the FDA reviewers.
During deliberation among the FDA review staff which included cli-
nicians, clinical pharmacologists, pharmacometricians and biostatisticians,it was proposed by the clinical pharmacologists and agreed to by othersto explore whether the PK/PD analyses could provide the confirmatory
Fig. 4. Change in pain score from baseline over time. Modeling and Simulation in New Drug Development Fig. 5. Model predicted gabapentin effect by total daily dose and estimated dose absorbed.
evidence of efficacy. To replace a replicate clinical trial the PK/PD analy-sis would have to withstand the same qualitative and quantitative reviewthat data from an AWC would, so the analyses were further tested andreviewed by the FDA, who reached similar conclusions:– The PK/PDresults confirmed evidence of efficacy across the three studied doses, sothat additional clinical trials would not be needed for approval of theproduct.
In the Package Insert of approved drugs, the establishment of effec-
tiveness of drugs is described in the clinical studies section, where thedesign, patient populations, and statistical considerations of the studies areexplained. In the case of gabapentin, the clinical trials section of the Pack-age Insert states “PK/PD modeling provided confirmatory evidence of effi-cacy across all doses” to explain the basis of establishing the effectivenessof Neurontin
In a recent publication (14) Lewis Sheiner and co-authors contend
that “convincing evidence of the pharmacologic mechanism of the clin-ical effect of a drug serves the same purpose as—and can be derivedmore directly from sources other than—a second large and expensive clin-ical trial”. They proposed that ‘contrary to na¨ıve fears of the conse-quences of “lowering standards” of effectiveness, adopting the now legally
Miller et al.
sanctioned new standard of a single clinical trial plus confirmatory evi-dence (SCT-CE) would provide a scientific and regulatory framework forencouraging more rational, more efficient, and more informative clinicaldrug development.’ The rational drug development paradigm that he soenthusiastically encouraged seems to be gaining traction. CONCLUSION
In the publication by the FDA titled “Innovation or Stagnation: Chal-
lenge and Opportunity on the Critical Path to New Medical Products” (2)the opportunities offered by the concept of model-based drug developmentare mentioned, and the reference cited is the seminal manuscript by LewisSheiner regarding the “learn-confirm” paradigm (1). This present reviewgives some examples of work based on the concepts championed by LewisSheiner, in which pharmaco-statistical models of drug efficacy and safety aredeveloped from preclinical and available clinical data to improve drug devel-opment knowledge management and development decision-making. Withthe publication of the Innovation or Stagnation document, the FDA alsohas acknowledged the value of these concepts and will collaborate with oth-ers in the use of modeling and simulation to improve trial design and drugdevelopment decision-making. REFERENCES
1. L. B. Sheiner. Learning versus confirming in clinical drug development. Clin. Pharma-col. Ther. 61:275–291 (1997).
2. Food and Drug Administration. Innovation; Stagnation: Challenge and Opportu-
nity on the Critical Path to New Medical Products. www.fda.gov/oc/initiatives/critical-path/whitepaper.html. 2004.
3. L. B. Sheiner, D. R. Stanski, S. Vozeh, R. D. Miller, and J. Ham. Simultaneous mod-
eling of pharmacokinetics and pharmacodynamics: application to d-tubocurarine. Clin. Pharmacol. Ther. 25:358–371 (1979).
4. S. L. Beal and L. B. Sheiner. NONMEM Users Guide. NONMEM project group. Uni-
versity of California, San Francisco, 1998.
5. R. Miller, J. D. Hermann, W. Ewy, and K. G. Kowalski. The strategic role and
application of pharmacokinetic/pharmacodynamic modeling in drug development. In:Pharmacokinetics in Drug Development: Clinical Study Design and Analysis, Vol. 1,P. L. Bonate and D. R. Howard (eds.), AAPS Press, Arlington VA, 2004, pp. 551–581.
6. N. H. G. Holford and K. E. Peace. Methodologic aspects of a population pharmaco-
dynamic model for cognitive effects in Alzheimer’s patients treated with tacrine. Proc. Natl. Acad. Sci. USA. 89:11466–11470 (1992a).
7. N. H. G. Holford and K. E. Peace. Results and validation of a population pharmaco-
dynamic model for cognitive effects in Alzheimer’s patients treated with tacrine. Proc. Natl. Acad. Sci. USA. 89:11471–11475 (1992b).
8. N. H. G. Holford and K. E. Peace. The effect of tacrine and lecithin in Alzhei-
mer’s disease. A population pharmacokinetic analysis of five clinical trials. Eur. J. Clin. Pharm. 47:17–23 (1994). Modeling and Simulation in New Drug Development
9. Federal Food, Drug and Cosmetic Act of 1938, Drug Amendments of 1962. Pub.
L. No. 87–781, 76 Stat. 780 (1962).
10. Food and Drug Administration Modernization Act of 1997, Pub. L. No. 105–115, 111
11. Guidance for Industry: Exposure-response relationships, study design, data analysis
and regulatory applications. Food and Drug Administration, May 2003, Guidance forIndustry: Providing Clinical Evidence of Effectiveness for Human Drugs and Biologi-cal Products. Food and Drug Administration, May 1998.
12. B. Frame, P. Burger, R. Miller, J. Cook, E. Garafolo, L. Knapp, H. N. Bockbrader,
and B. W. Corrigan, An Analysis of Exposure Response data for Gabapentin for theTreatment of Neuropathic Pain. Neuropathic Pain Meeting, San Francsico, 2001.
(Parke-Davis) Capsules. Physicians Desk Reference Electronic LibraryTM
14. C. C. Peck, D. B. Rubin, and L. B. Sheiner. Hypothesis: A single clinical trial plus
causal evidence of effectiveness is sufficient for drug approval. Clin. Pharmacol. Ther. 73:481–490 (2003).
SONDERVERÖFFENTLICHUNG ZU "NAUTISCHE NACHRICHTEN" Medizin-Box für Sportboote * Dr. med. Frank Praetorius (Innere Medizin/Kardiologie/Reisemedizin). Beratung: Chefapothekerin Dr. Antje Kneisel (Klinikum Offenbach am Main) Segler als Bootseigner können sich sowohl im Tropenfahrt wird sie wie die Medikamenten-gewohnten Küstenbereich wie auch auf sorg-Box durch eine
articles nature publishing group childhood obesity Intervention for Childhood Obesity Paul M. Sacher1, Maria Kolotourou1, Paul M. Chadwick2, Tim J. Cole3, Margaret S. Lawson1, Alan Lucas1 and Atul Singhal1 The aim of this study was to evaluate the effectiveness of the Mind, Exercise, Nutrition, Do it (MEND) Program, a multicomponent community-based childhood obesity intervention (w
 Modeling and Simulation in New Drug Development
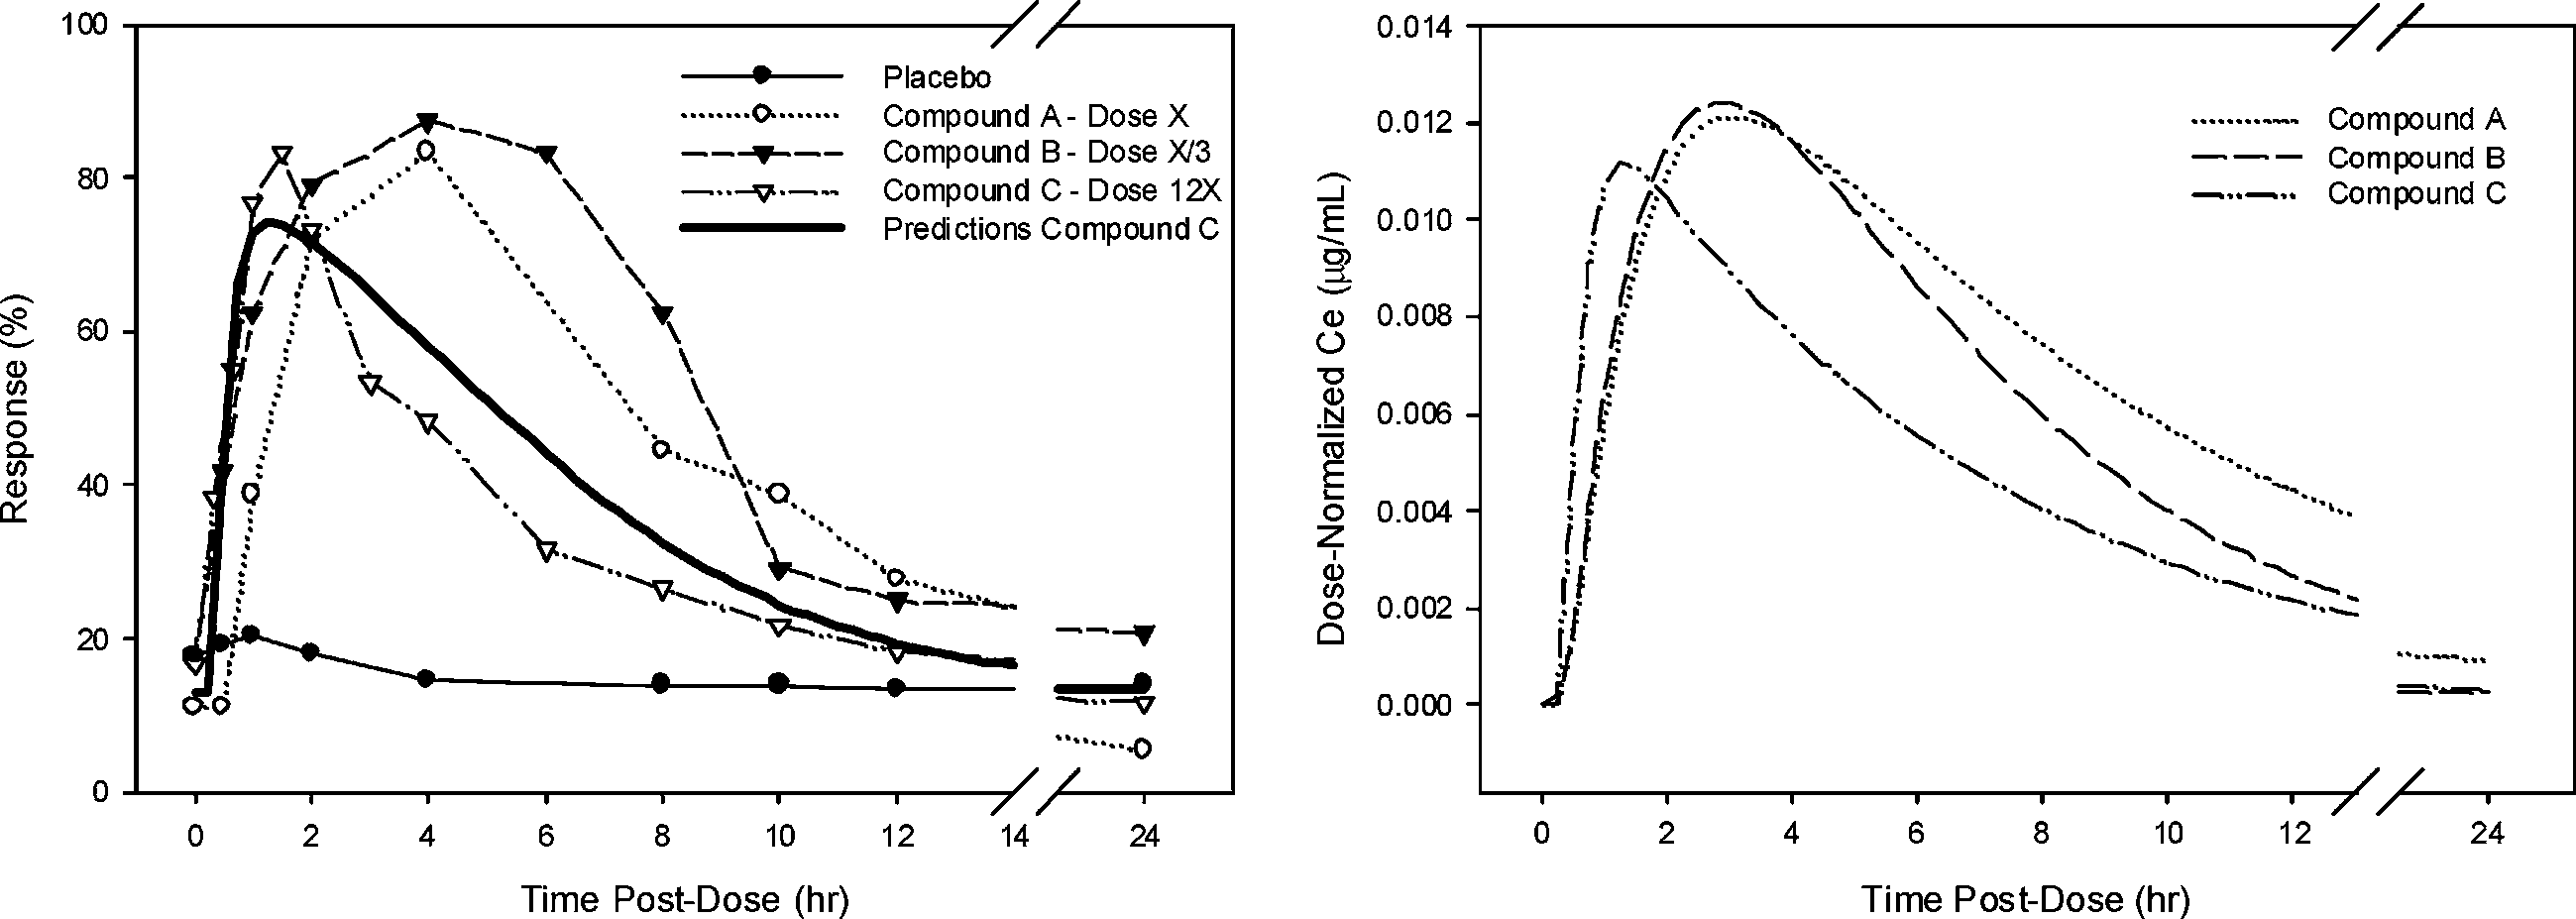 Modeling and Simulation in New Drug Development
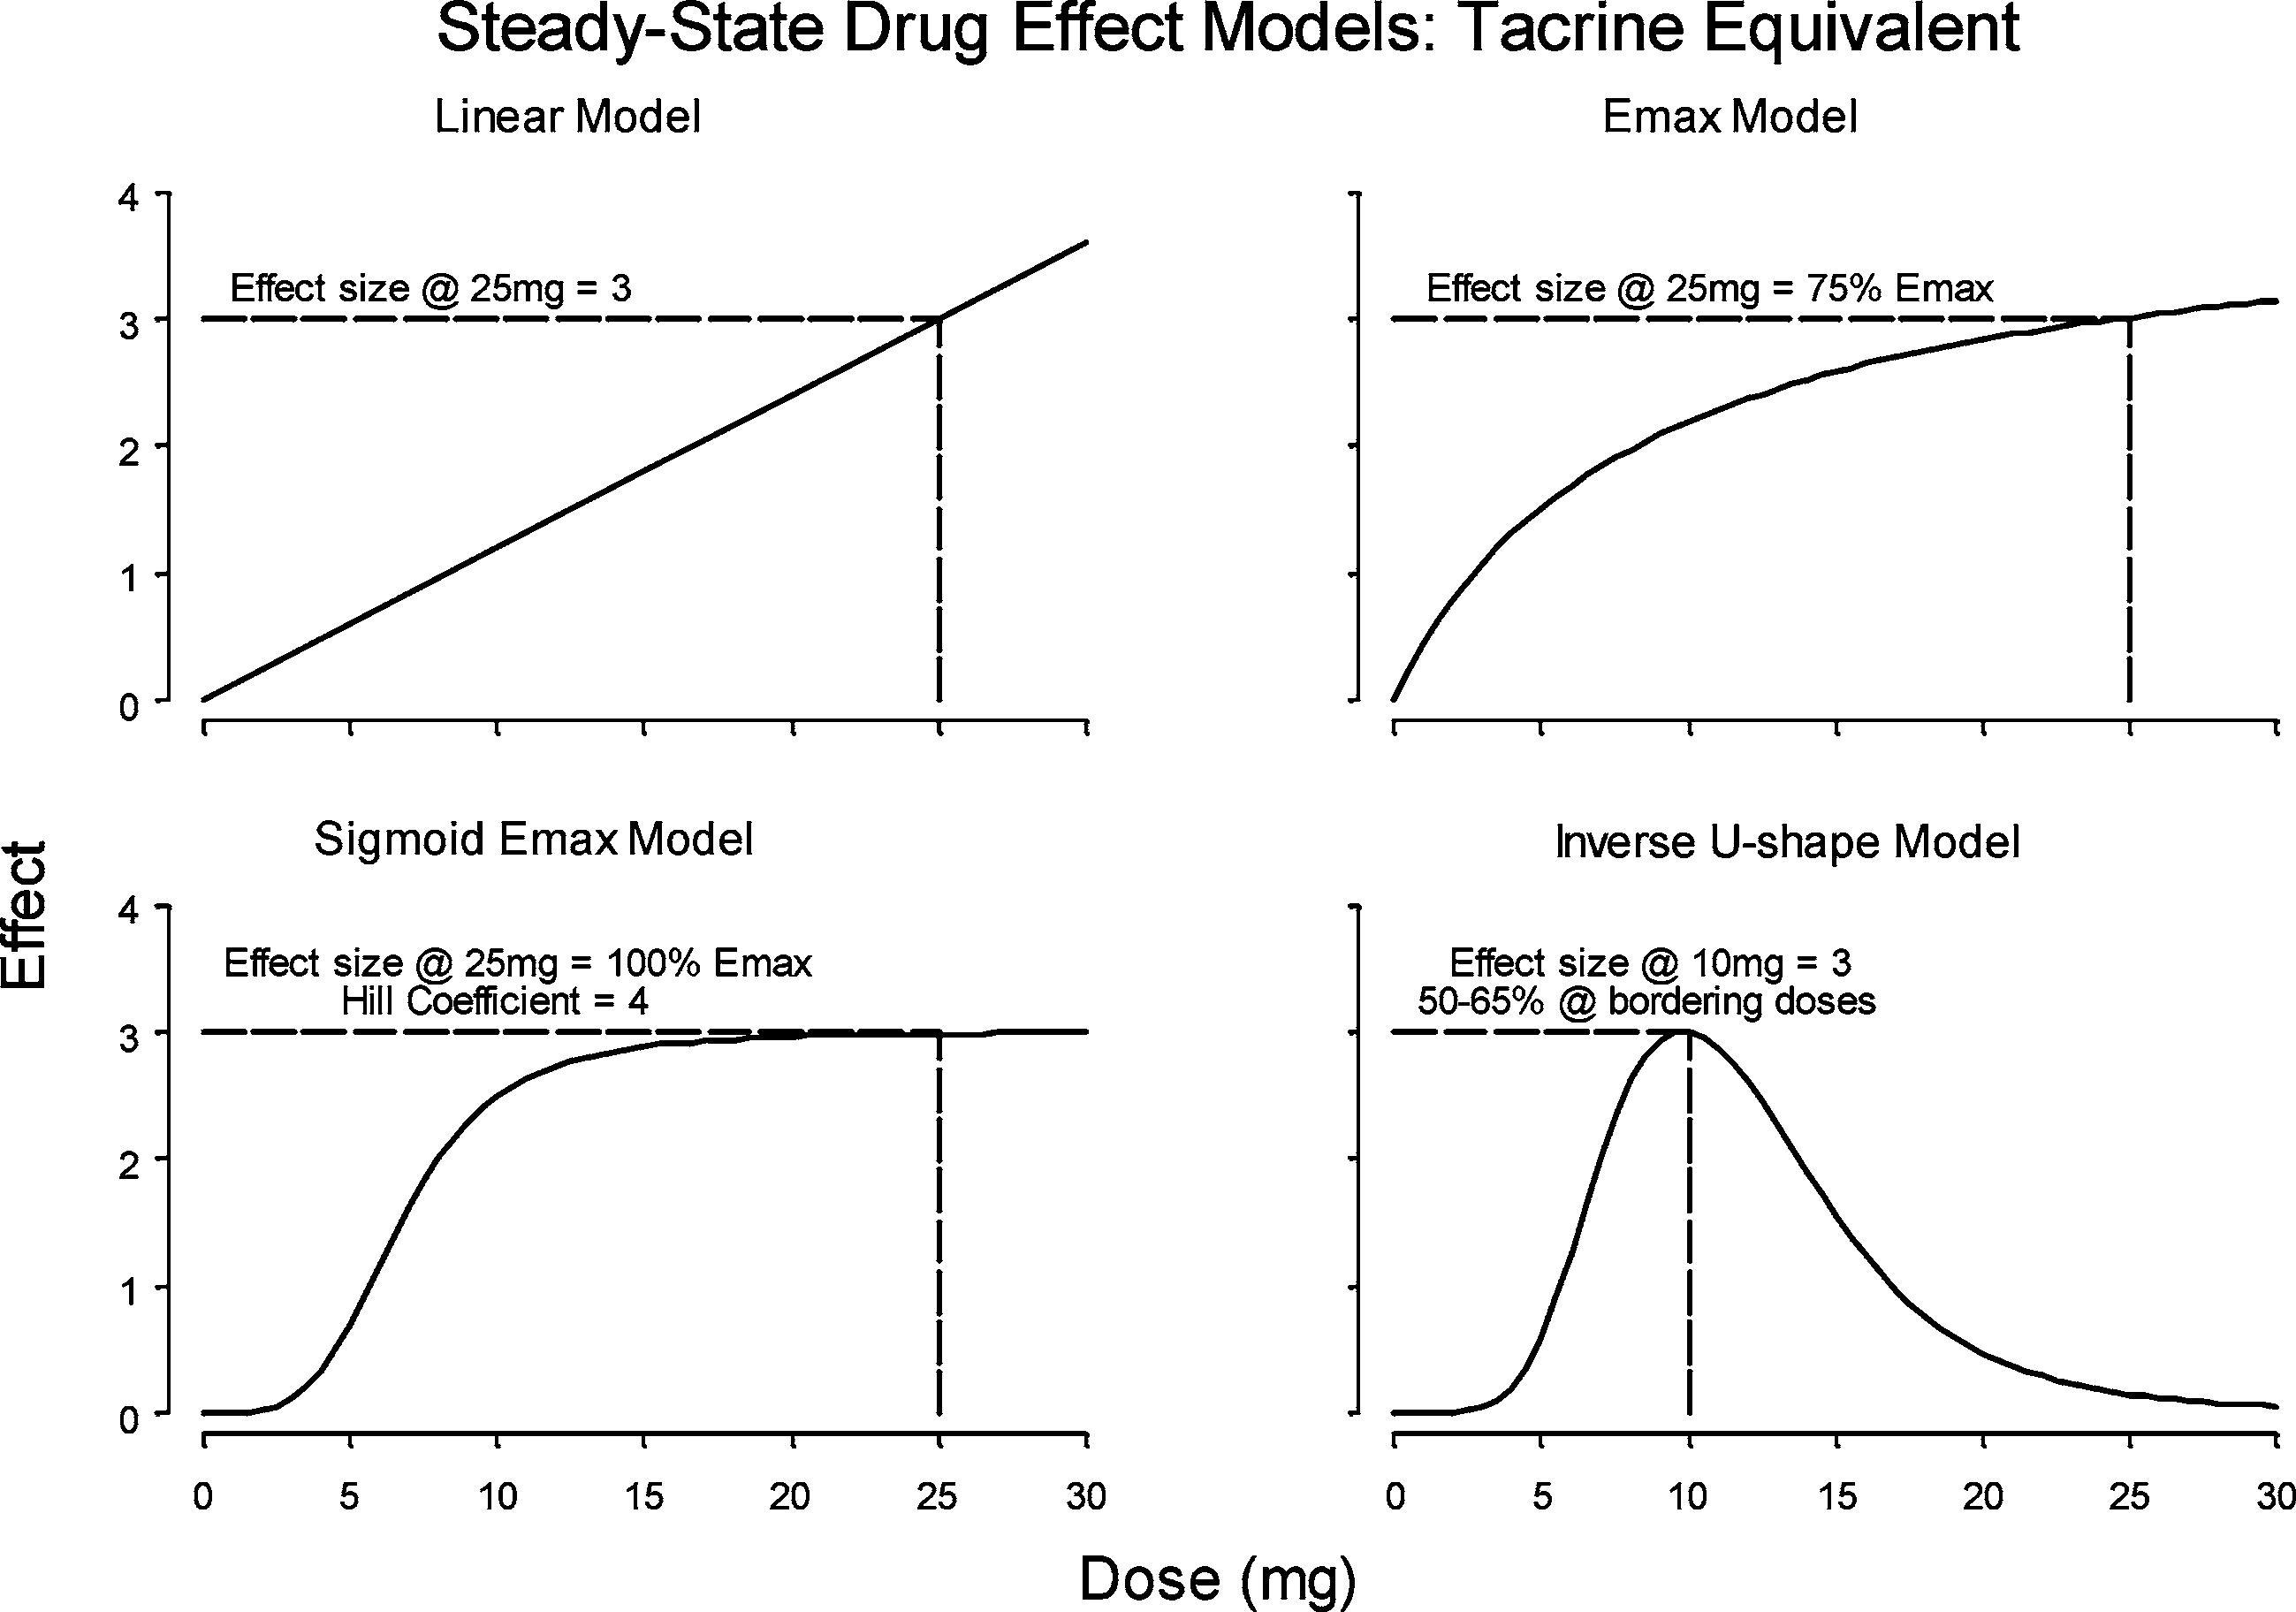 Miller et al.
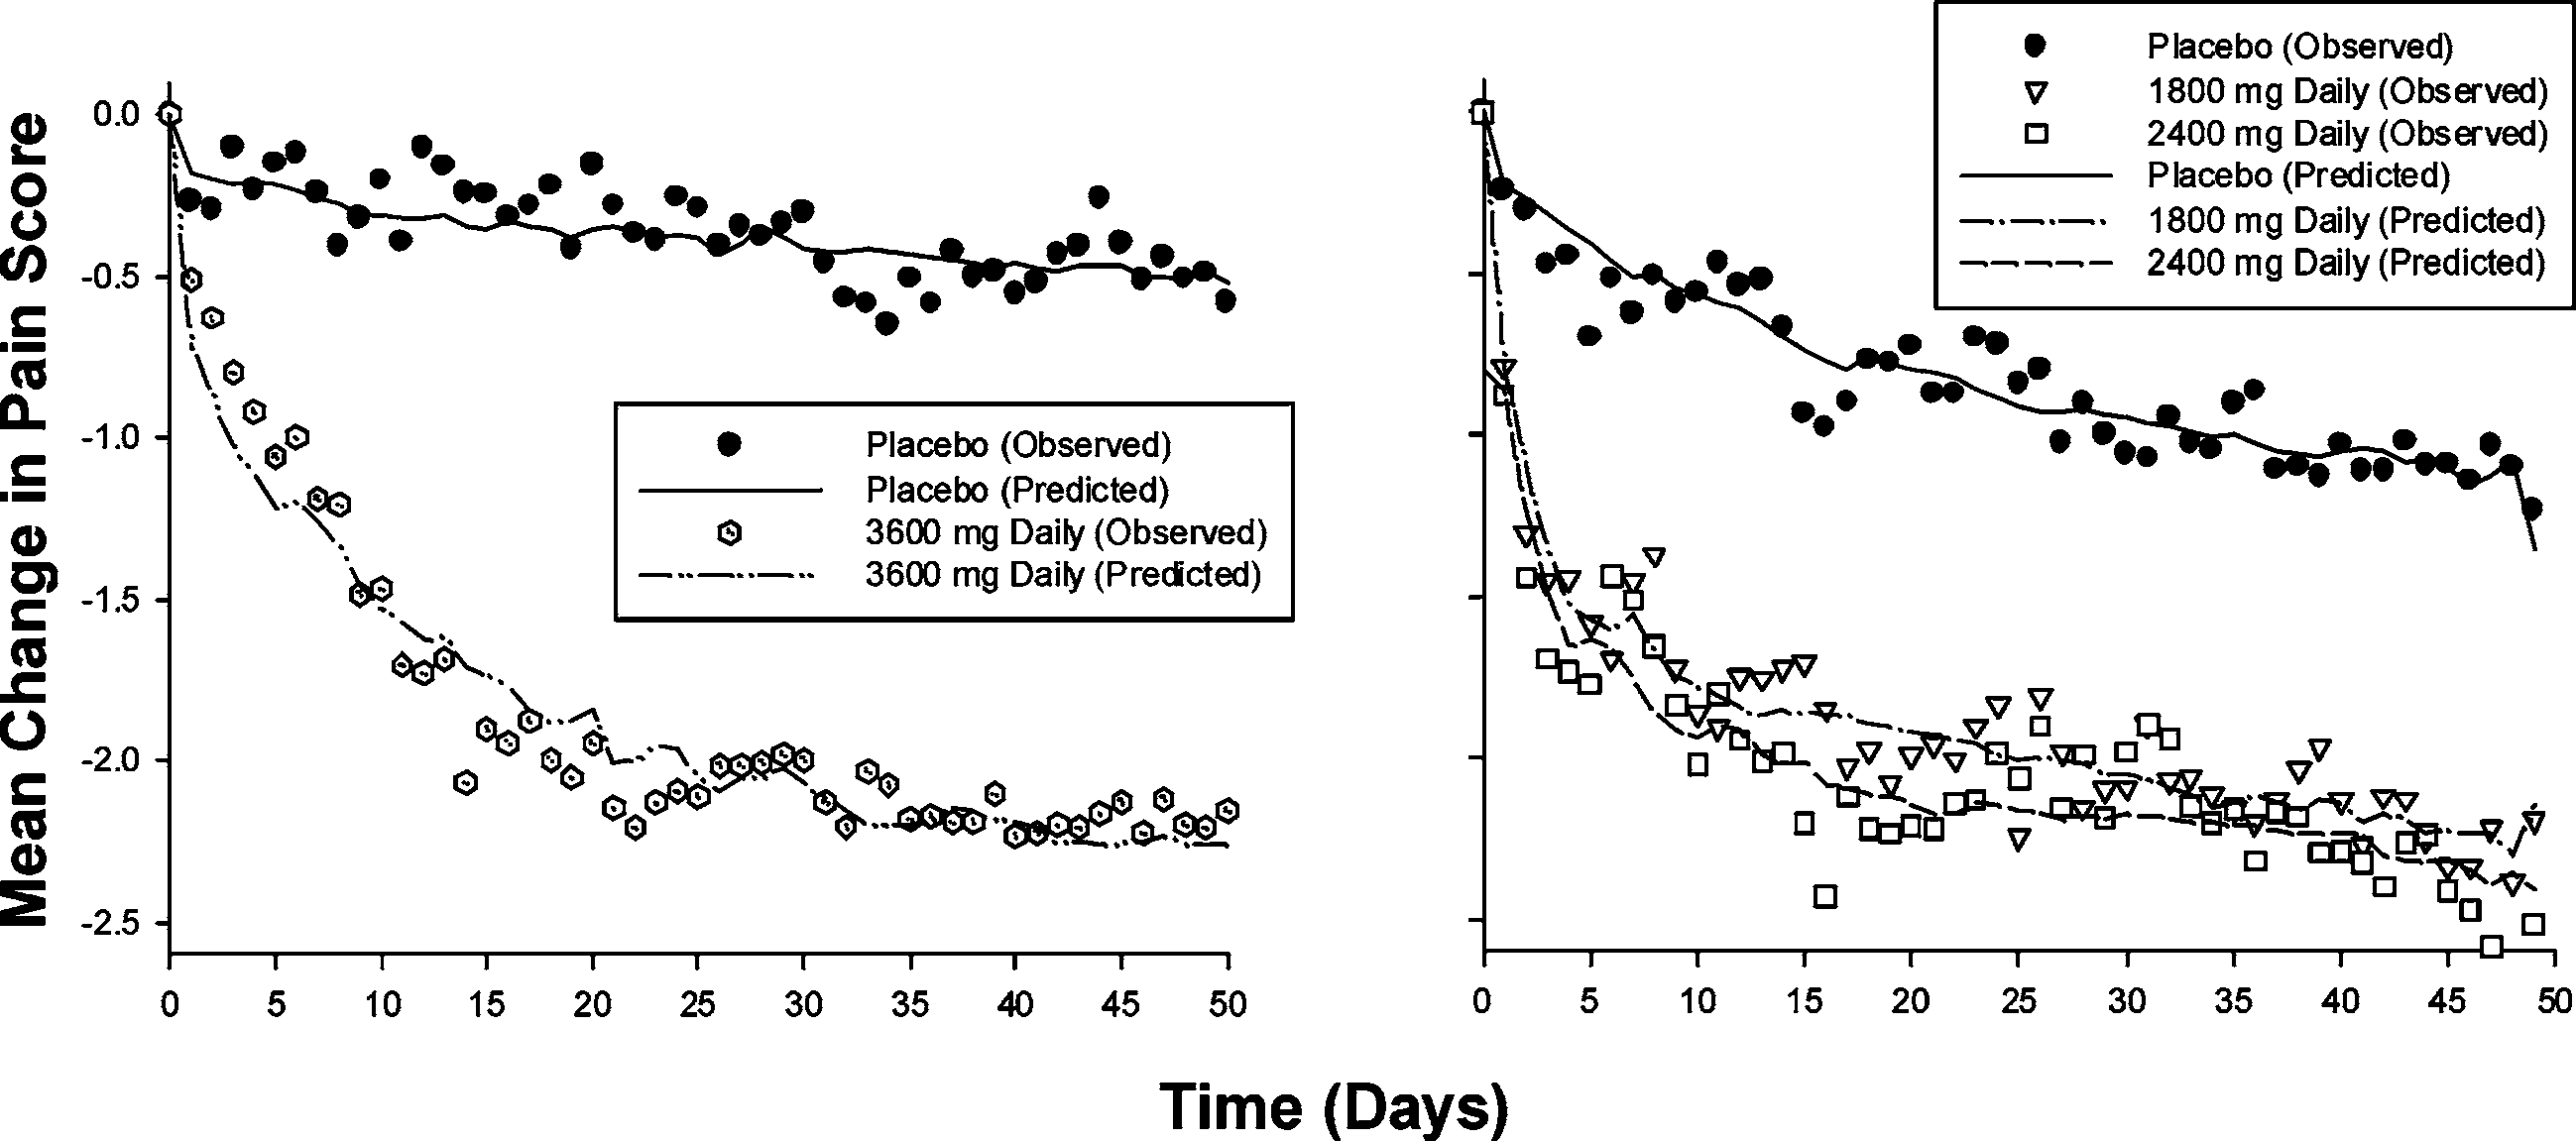 Miller et al.
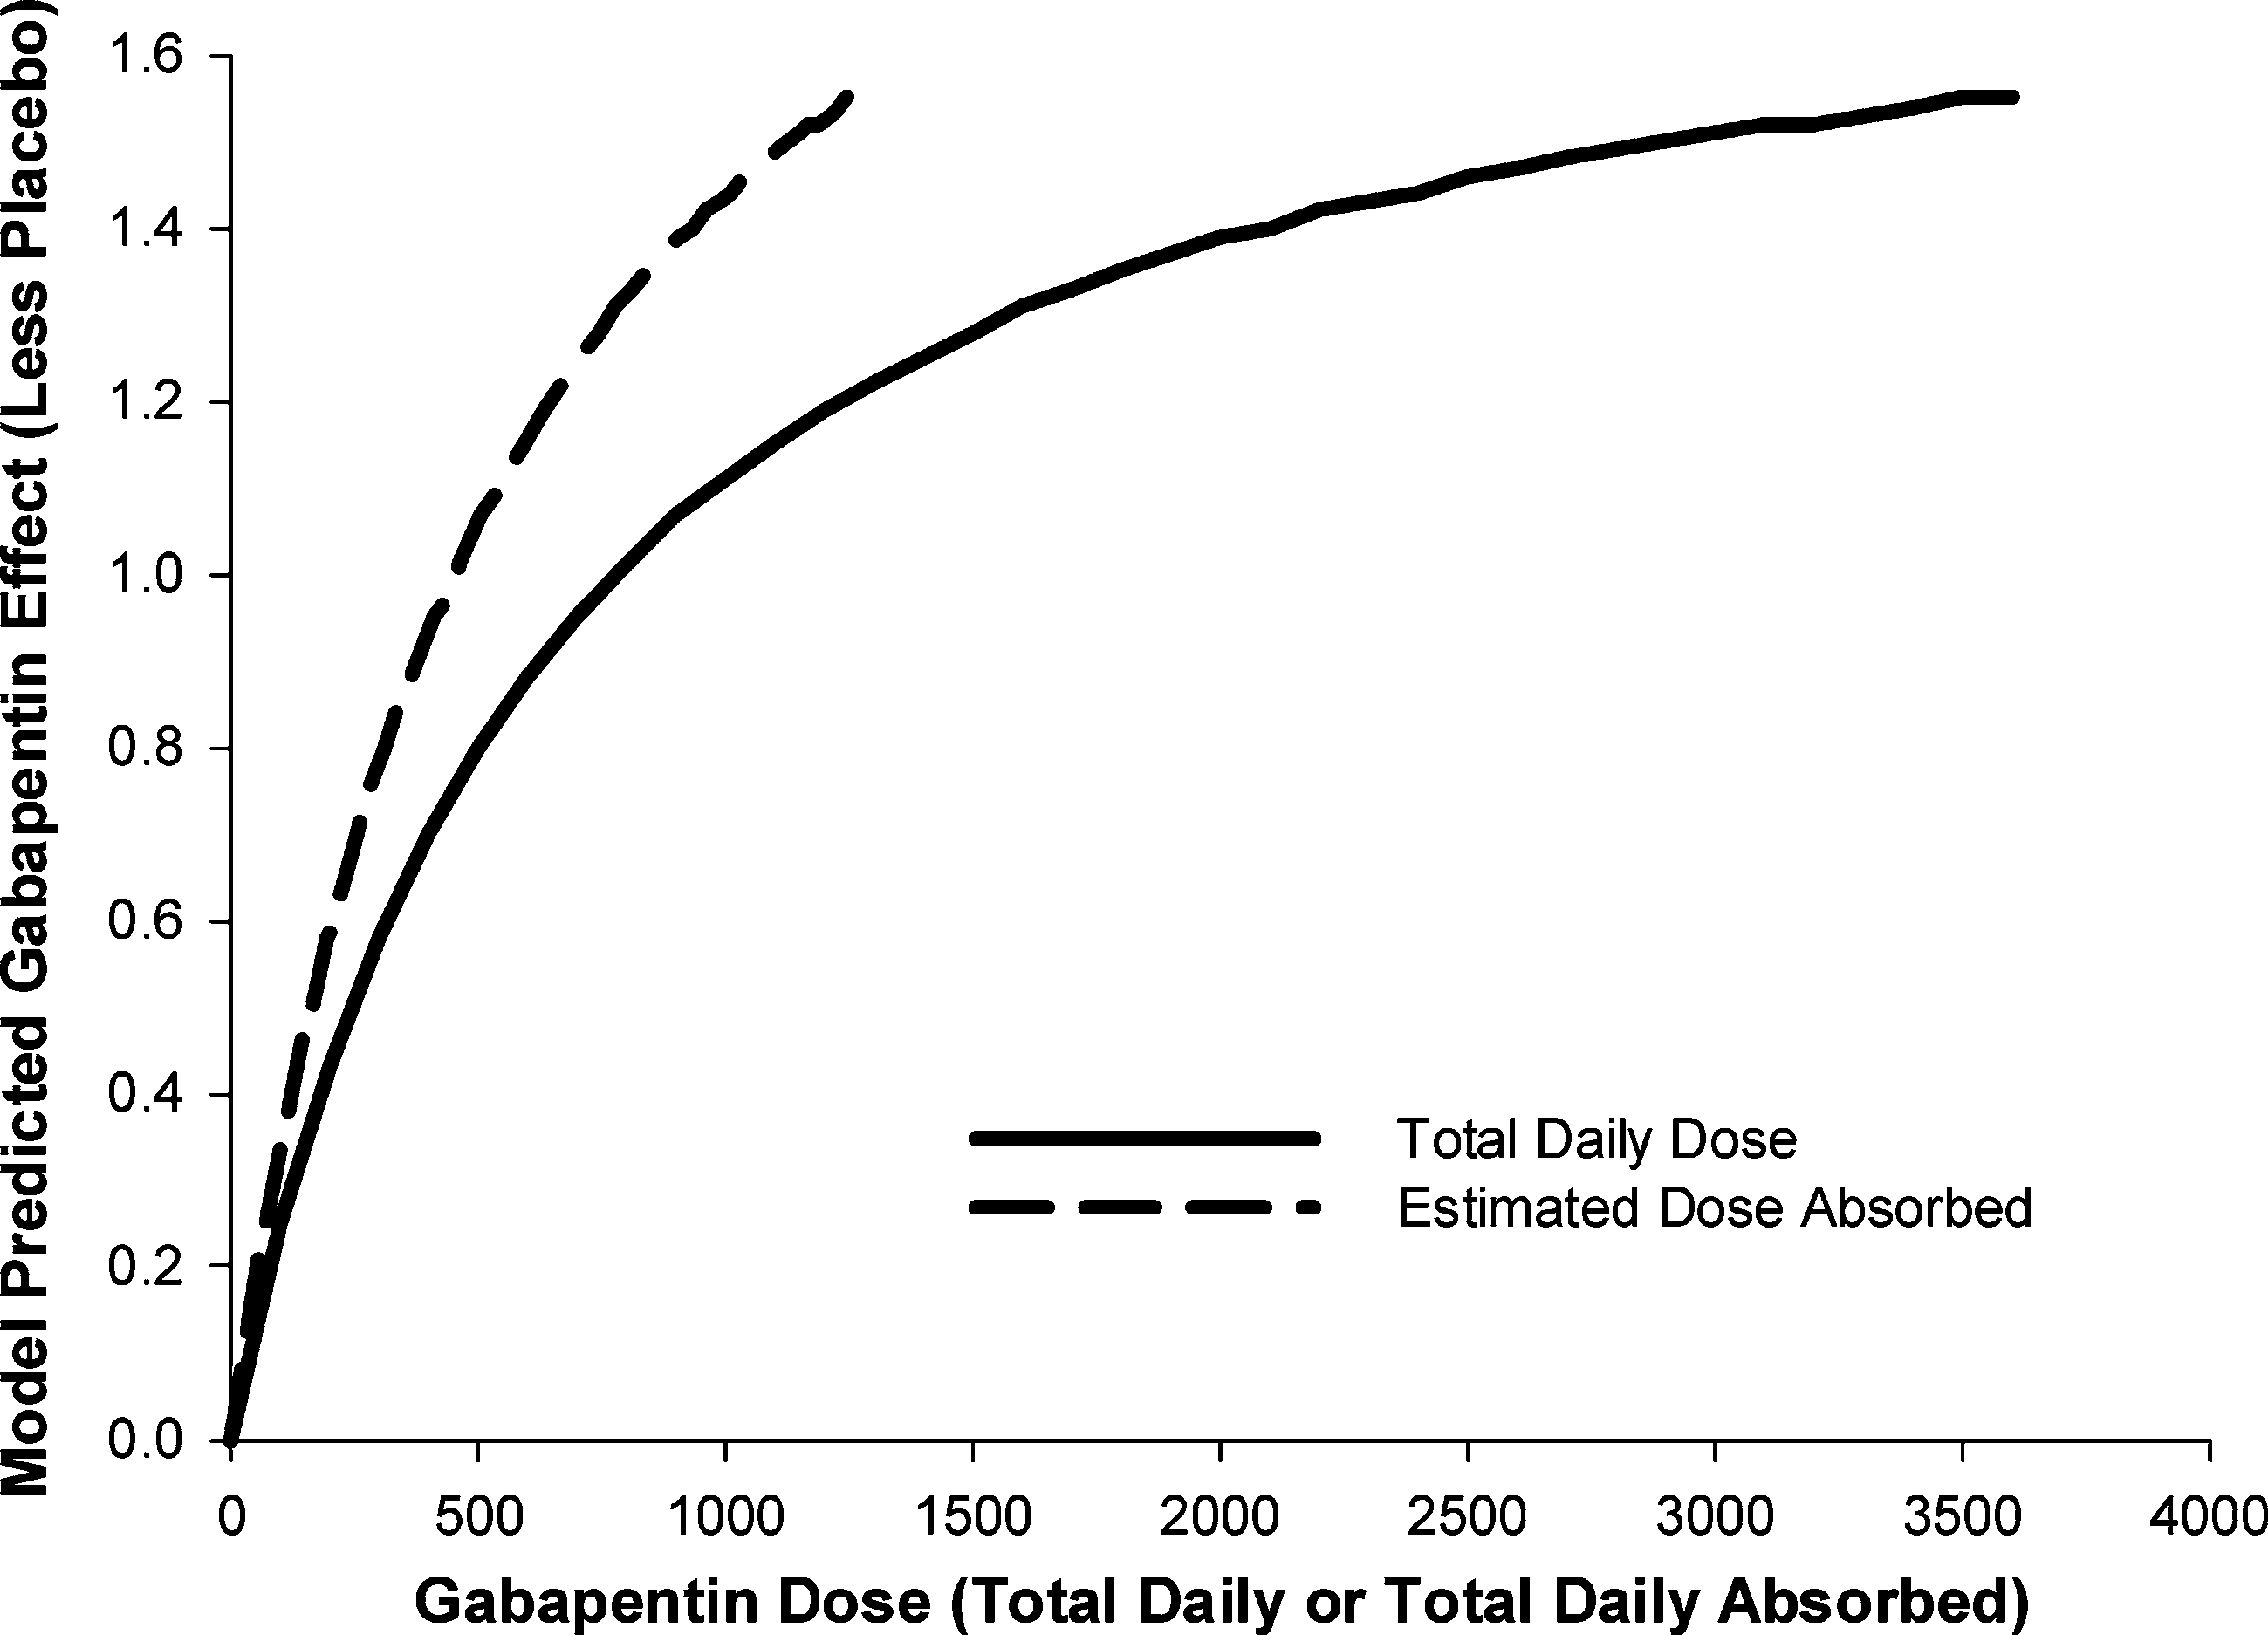 Modeling and Simulation in New Drug Development