Probabilistic clustering of sequences: Inferring new bacterial regulons by comparative genomics Erik van Nimwegen†‡, Mihaela Zavolan§, Nikolaus Rajewsky†, and Eric D. Siggia†
†Center for Studies in Physics and Biology and §Laboratory of Computational Genomics, The Rockefeller University, 1230 York Avenue,New York, NY 10021
Edited by Jeffrey W. Roberts, Cornell University, Ithaca, NY, and approved March 28, 2002 (received for review December 20, 2001)
Genome-wide comparisons between enteric bacteria yield large
Previous algorithms that fit weight matrices (WMs) cannot
sets of conserved putative regulatory sites on a gene-by-gene basis
process genome scale data representing sites from hundreds of TFs
that need to be clustered into regulons. Using the assumption that
simultaneously. Other schemes (7), not based on WM representa-
regulatory sites can be represented as samples from weight ma-
tions of regulatory sites, are not well suited for processing sites that
trices (WMs), we derive a unique probability distribution for
were inferred from interspecies comparison. Our algorithm parti-
assignments of sites into clusters. Our algorithm, ‘‘PROCSE’’ (prob-
tions the entire set of sites at once, infers the number of clusters
abilistic clustering of sequences), uses Monte Carlo sampling of this
internally, and assigns probabilities to all partitions of sequences
distribution to partition and align thousands of short DNA se-
into clusters. Within this framework, we also derive theoretical
quences into clusters. The algorithm internally determines the
limits on the clusterability of sets of regulatory sites. number of clusters from the data and assigns significance to the
A set of sites, sampled from a set of unknown WMs, is said to
resulting clusters. We place theoretical limits on the ability of any
be clusterable if it is possible to infer which sites were sampled
algorithm to correctly cluster sequences drawn from WMs when
from the same WM. If the WMs from which the sites were
these WMs are unknown. Our analysis suggests that the set of all
sampled are known, we have the much simpler classification
putative sites for a single genome (e.g., Escherichia coli) is largely
problem: determining which sites were sampled from which
inadequate for clustering. When sites from different genomes are
WM. It is important to realize that the cell is performing a
combined and all the homologous sites from the various species
classification task because it knows the WMs of the TFs, i.e. the
are used as a block, clustering becomes feasible. We predict 50 –100
chemistry of the DNA–protein interaction automatically assigns
new regulons as well as many new members of existing regulons,
a binding energy to each site just as a WM assigns a score to each
potentially doubling the number of known regulatory sites in
site. However, since we cannot infer binding specificities from a
E. coli.
TF’s protein sequence, we face the much harder clustering task.
Our theoretical arguments and the available data for E. coli in
New microbial genomes are sequenced almost daily, and the fact suggest that the set of all regulatory sites in the E. coli
first step in their annotation is the elucidation of their
genome is unclusterable by itself. However, we also show how
GENETICS
protein-coding regions. The noncoding regions of the genome
this problem can be circumvented by taking into account infor-
can provide clues about gene regulation, because they contain
mation from interspecies comparison.
various regulatory elements. These elements generally are much
smaller and more variable than typical coding regions and thus
harder to identify. Computational methods are needed, because
Protein binding sites in bacterial genomes are commonly de-
even for Escherichia coli there are only 60–80 genes for which
scribed by a WM, wi␣, which gives the probabilities of finding base
binding sites and regulated genes are known (1, 2), whereas
␣ at position i of the binding site (13). The probabilities in
protein sequence homology suggests there are Ϸ300 DNA-
different columns i are assumed independent, which accords well
binding proteins (3). Binding sites have been identified experi-
with existing compilations (1). Motif-finding algorithms (4–6)
MATHEMATICS
mentally in only 300 of the 2,400 regulatory regions of E. coli (2).
score the quality of an alignment of putative binding sites by the
For important pathogens such as Vibrio cholerae, Yersinia pestis,
information score I of its (estimated) WM,
or Mycobacterium tuberculosis very little is known about gene
regulation from direct experimentation. I ϭ w␣ log͑w␣͞b␣͒,
Computational strategies for the discovery of regulatory sites
began with algorithms (4–6) that identified sets of similar
sequences in the regulatory regions of functionally related
where b␣ is the background frequency of base ␣, and the w␣ are
groups of genes. More recently, algorithms were proposed to
the WM probabilities estimated from the sequences in the
identify repetitive patterns within an entire genome (7). Here we
alignment. The rationale for this scoring function is that thei
develop methods for partitioning a large set of putative regula-
probability of an n sequence alignment with frequencies w␣
tory sites into clusters based on sequence similarity, with the goal
arising by chance from n independent samples of the background
of identifying regulons. That is, we aim to partition the set of sites
distribution of bases b␣ is given by P Ϸ eϪnI.
such that each cluster corresponds to those targeted by the same
Instead of distinguishing sequence motifs for a single TF
against a background distribution, our task is to cluster a set of
Many authors have noted the potential of interspecies com-
binding sites of an unknown number of different TFs, i.e. a set
parisons to elucidate regulatory motifs (e.g., ref. 8). Generally,
of sequences sampled from an unknown number of unspecified
a group of functionally related genes in bacteria is pooled to
WMs. To this end, we consider all ways of partitioning our data
extract common sites within the regulatory regions of these genes
set into clusters and assign a probability to each partition. Fig.
(e.g., refs. 9 and 10). More recent studies (11, 12) have shown
that when upstream regions of orthologous genes from several
This paper was submitted directly (Track II) to the PNAS office.
suitably related species are compared at once, there is sufficient
Abbreviations: TF, transcription factor; WM, weight matrix; ML, maximum likelihood.
signal for regulatory sites to be inferred on a gene-by-gene basis,
yielding thousands of potentially new sites. These sites form the
To whom reprint requests should be addressed at: Center for Studies in Physics andBiology, The Rockefeller University, Box 75, 1230 York Avenue, New York, NY 10021.
data sets on which our algorithm operates.
www.pnas.org͞cgi͞doi͞10.1073͞pnas.112690399
PNAS ͉ May 28, 2002 ͉ vol. 99 ͉ no. 11 ͉ 7323–7328
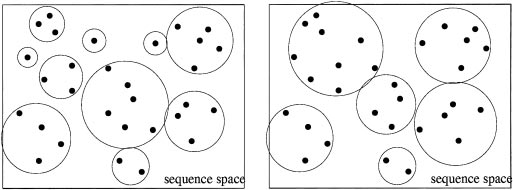
Two ways of partitioning the same set of sequences into clusters. The
rectangle schematically represents the space of all possible DNA sequences ofsome particular length l. The dots denote the sequences in the data set, andthe circles indicate which sequences are partitioned together into clusters.
1 depicts, schematically, two ways of partitioning a set of
sequences into clusters. We will assign probabilities to all such
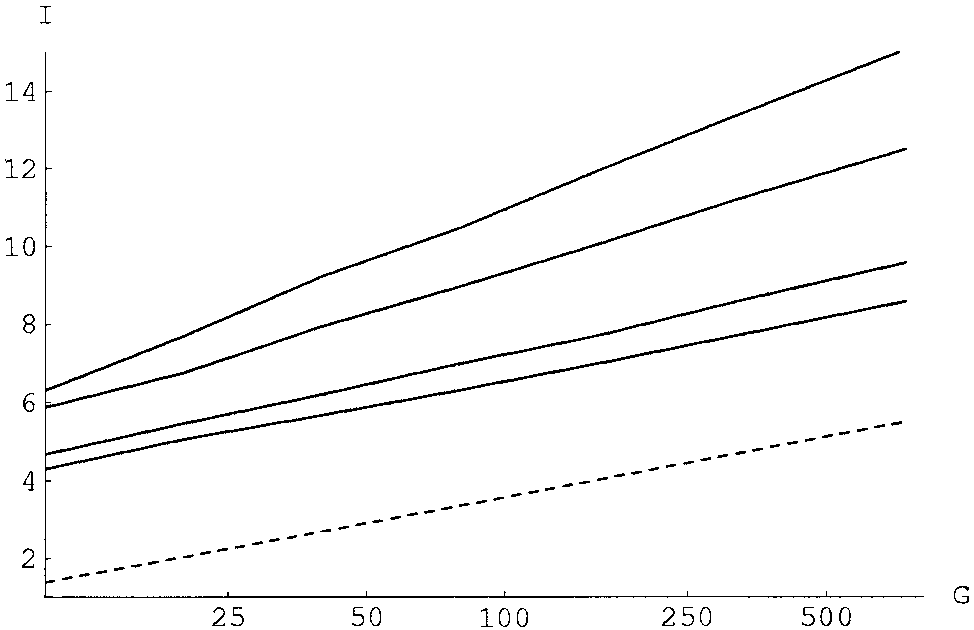
The critical information score I for clusterability (solid lines) or classi-
partitions. The probability of a partition is the product of the
fiability (dashed line) as a function of the number of clusters G (shown on a logscale). The solid lines correspond, from top to bottom, to sets of n ϭ 3, 5, 10,
probabilities, for each cluster, that all sequences within the
and 15 samples per cluster. The WM length is l ϭ 27.
To calculate these probabilities, consider first the conditional
probability P(S͉w) that a set of n length l sequences S was drawn
C. For instance, to calculate the probability that the data set
separates into n clusters, one sums P(C͉D) over all partitions that
contain n clusters. Analogously, we can calculate the probability
that any particular subset of sequences forms a cluster by
summing P(C͉D) over all partitions in which this occurs. Note
that our clustering framework thus allows for direct calculations
of these quantities. In the implementation section below we
i is the letter at position i in sequence s. The probability
P(S) that all sequences in S came from some w can be obtained
describe how we sample P(C͉D) and identify significant clusters
by integrating over all allowed w, namely over the simplex ͚ i
by finding subsets of sequences that cluster consistently.
ϭ 1 for each position i. Lacking any knowledge regarding w, we
Generalizations to data arising from WMs of different lengths
use a uniform prior over the simplex. We obtain
and sequences that are not aligned consistently are straightfor-
ward and considered below. It is also trivial to incorporate prior
information on the number of clusters (e.g., that it should equal
P͑S͒ ϭ ͵P͑S͉w͒dw ϭ ͩn ϩ 3ͪϪlClassifiability vs. Clusterability
where ni␣ is the number of occurrences of base ␣ in column i. The
Correct regulation of gene expression requires that TFs should
last factor in Eq. 3 is just the inverse of the multinomial factor that
bind preferentially to their own sites. Associating TFs with WMs,
counts the number of ways of constructing a specific vector (na, nc,
P(s͉w) commonly is taken to be the probability that w binds to
ng, nt) from n bases, which bears an obvious relation to Eq. 1. High s. Correct regulation thus implies that for a sample s from w, we
probabilities thus are given to vectors, which can be realized in the
have that P(s͉w) Ͼ P(s͉wЈ) for all other TFs wЈ
least number of ways. The factor (nϩ3
call a classification task. Formally, we are given a set of WMs and
vectors (na, nc, ng, nt) that can be obtained from n samples.
a set of sequences sampled from them and assign each sequence
We now can define for any partition C of a data set of
s to the WM from the set that maximizes P(s͉w). We define the
sequences D into clusters Sc the likelihood P(D͉C) that all
data to be classifiable when, in at least half of the cases, the WM
sequences in each Sc were drawn from a single WM: P(D͉C) ϭ
w that maximizes P(s͉w) is the WM from which s was sampled.
͟c P(Sc), with P(Sc) given by Eq. 3. Then the posterior proba-
As mentioned in the Introduction, classification is much simpler
bility P(C͉D) for partition C given the data D is
than clustering a set of sites in the absence of knowledge of the
set of WMs from which they were sampled. P͑D͉C͒͑C͒
To quantify clusterability, assume we are clustering nG se-
CЈ P͑D͉CЈ͒͑CЈ͒
quences that were obtained by sampling n times from each of G
different WMs. For each of these WMs we can calculate the
where (C) is the prior distribution over partitions, which we will
probability that m of its n samples cocluster by summing the
probabilities P(C͉D) over all partitions C in which m, and no
Consider the simplest example of a data set of only two sequences
more than m, samples of w occur together in any of the clusters.
with matching bases in b of their l positions. We have P ϭ 2b(1͞20)l
We will define the set to be ‘‘clusterable’’ if for more than half
for the probability that the sequences came from the same WM,
of the G WMs the average of m, ͗m͘ Ͼ n͞2.
whereas P ϭ (1͞16)l for the probability that they came from
We have performed analytical and numerical calculations that
different WMs. P(C͉D) thus will prefer to either cluster or separate
identify under what conditions a data set is classifiable and clus-
the two sequences depending on b. In general, the probability
terable. This theory is beyond the scope of this paper and will be
distribution P(C͉D) will prefer partitions in which similar sequences
reported elsewhere. The results are summarized in Fig. 2. Given the
are coclustered. The state space of all partitions (the number of
information score I (Eq. 1) of a WM, the fraction of the space of
which grows nearly as rapidly as n!; ref. 14) acts as an ‘‘entropy,’’
4l sequences filled by the binding sites for this WM is eϪI. One thus
which opposes (stable) clustering of similar sequences.
can regard I as a measure of the specificity of a WM. Fig. 2 shows
The probability distribution Eq. 4 allows us to calculate any
the minimal WM specificity necessary to cluster (solid lines) or
statistic of interest by summing over the appropriate partitions
classify (dashed line) as a function of the number of WMs G and
7324 ͉ www.pnas.org͞cgi͞doi͞10.1073͞pnas.112690399
Monte Carlo sampling of partitions: example of a move from partition
C to partition CЈ. The dots are sequences, and the circles delineate the clusters.
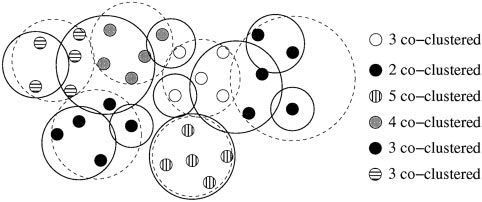
The ML partition obtained by annealing is indicated by the thin, dashed
circles and the fill patterns of the dots. The thick lines show an alternativepartition that may arise during sampling. The number of coclustering members
the number of samples n per WM. Fig. 2 shows that exp(ϪI) ϰ 1͞G
in this partition are shown on the right for each of the ML clusters.
for classification and exp(ϪI) ϰ 1͞G2 for clustering a set of n ϭ 3
binding sites, with fractional exponents in between these extremes.
Thus, all G WMs together consume a fixed fraction of sequence
illustrates this procedure. For each partition encountered during
space at the classification threshold (independent of G), while it
the sampling, we define the number of coclustering members of an
decreases as a function of G at the clusterability threshold. More-
ML cluster as the maximum number of mini-WMs from the ML
over, there is a significant gap between the requirements for
cluster that co-occur in a single cluster (see Fig. 4). In this way we
classification vs. clustering even for large numbers of samples. Thus,
measure, for each ML cluster, the probabilities p(k) that k of its
clustering is impossible for data sets close to the classification
members cocluster. The mean size of the cluster thus is ͚k k p(k).
threshold. The results presented below suggest that the collection of
Finally, we calculate the minimal length interval [kmin, kmax] for
E. coli binding sites may well be in this unclusterable regime, where
p(k) Ͼ 0.95. All clusters for which k
few regulons can be inferred correctly.
However, comparative genomic information can salvage this
This method is computationally prohibitive for large data sets
situation. The putative binding sites of our data sets were extracted
(because we cannot run long enough to converge all cluster
by finding conserved sequences upstream of orthologous genes of
statistics). For larger data sets we measure, using several Monte
different bacteria (see below). Such conserved sequence sets are
Carlo random walks, the probability that each pair of mini-WMs
likely to contain binding sites for the same TF and should be
coclusters (note that these pair statistics cannot be calculated in
clustered together. Therefore, we can reduce the size of the state
terms of the sequences in the pair of mini-WMs themselves; they
space significantly by preclustering these conserved sites into so-
depend on the full data set). We then construct a graph in which
called mini-WMs, and instead of clustering single sequences we will
nodes correspond to mini-WMs, and edges between mini-WMs i
be clustering these mini-WMs with the same probabilities shown in
and j exist if and only if their coclustering probability pij Ͼ 1⁄2.
Eq. 3, which improves clusterability dramatically.
Candidate clusters now are given by the connected components of
GENETICS
this graph. The pairwise statistics are then processed further to
Implementation
obtain probabilistic cluster membership, which yields for each
We have implemented a Monte Carlo random walk to sample the
mini-WM i the probabilities pij that mini-WM i belongs to cluster j
distribution P(C͉D). At every ‘‘time step’’ we choose a mini-WM at
(see supporting information). We also calculate, for each cluster,
random and consider reassigning it to a randomly chosen cluster (or
the probability distribution p(k) of k of its members coclustering.
empty box). These moves are accepted according to the Metropol-
Cluster significance is judged from p(k) as described above. For-
is–Hastings scheme (15): moves that increase the probability
tunately, there is substantial agreement on the significant clusters
P(C͉D) are always accepted, and moves that lower P(C͉D) are
among these ways of extracting significant clusters from P(C͉D).
accepted with probability P(CЈ͉D)͞P(C͉D). Fig. 3 shows an example
MATHEMATICS
After we have inferred the clusters and their members, we can
of a move from a partition C to a partition CЈ. This sampling scheme
estimate a WM for each cluster. We then classify all mini-WMs
thus generates ‘‘dynamic’’ clusters, the membership of which fluc-
in the full data set in terms of these cluster WMs. Finally, we
tuates over time. Clusters may evaporate altogether, and new
search for additional matching motifs to the cluster WMs in all
clusters may form when a pair of mini-WMs is moved together. We
the regulatory regions of the E. coli genome. Details for all these
wish to identify ‘‘significant’’ clusters by finding sets of mini-WMs
procedures are described in the supporting information.
that are grouped together persistently during the Monte Carlo
sampling. Ideally, we would find a set of clusters, each with stable
Data Sets
‘‘core’’ members that are present at all times, while the remaining
Our primary data sets (11, 12) consist of alignments of relatively
mini-WMs move about between different clusters. Reality unfor-
short sequences, i.e. typically 15–25 bases, that where extracted
tunately is more complicated. One finds clusters that are drifting
from upstream regions of orthologous genes in different pro-
constantly such that their membership is uncorrelated on long time
karyotic genomes. Data set (11) uses the genomes of E. coli,
scales. Other clusters, with stable membership, may evaporate and
Actinobacillus actinomycetemcomitans, Haemophilus influenzae,
reform many times. Although we can sample P(C͉D) easily to obtain
Pseudomonas aeruginosa, Shewanella putrefaciens, Salmonella
significance measures for any given ‘‘candidate cluster,’’ the rich
typhimurium, Thiobacillus ferrooxidans, V. cholerae, and Y. pestis.
dynamics of drifting, fusing, and evaporating clusters makes it
Data set (12) uses E. coli, Klebsiella pneumoniae, S. typhimurium,
nontrivial to identify good candidate clusters. V. cholerae, and Y. pestis. An example alignment is shown in Fig.
We have experimented with a number of schemes for identifying
5. The available evidence suggests that these alignments either
candidate clusters (see supporting information, which is published
include or substantially overlap a set of binding sites for a TF (or
on the PNAS website, www.pnas.org). One approach is to search for
another kind of regulatory site). Our algorithm will have to
the maximum likelihood (ML) partition that maximizes Eq. 4, which
decide which stretch of bases in each alignment corresponds to
can be done by simulated annealing: we raise P(D͉C) to the power
the regulatory site. Known binding sites (1) are between 11 and
, increasing  over time (in practice  ϭ 3 is large enough). The
50 bases long with a mean of 24.5 and a standard deviation of just
ML partition gives us a set of candidate clusters. The significance
under 10. We will assume that all binding sites are exactly 27
of the ML clusters then are tested by sampling P(C͉D). Fig. 4
bases long, compromising between diluting the signal in the small
PNAS ͉ May 28, 2002 ͉ vol. 99 ͉ no. 11 ͉ 7325
data set with the site annotation. We performed two annealing runs
to identify an ML partition and then performed sampling runs to
test the significance of these ML clusters. We found that, in general,
there is good agreement between the annotation and the clusters
inferred by annealing. For 17 of the 24 TFs that form significant
clusters there was an analogous significant cluster obtained by the
annealing. The full results are in supporting information. We have
found also that the likelihood P(C͉D) for the partition obtained in
all annealing runs is significantly higher than that obtained when the
Operations on the data sets. Starting from an alignment of variable
sites are partitioned according to their annotation. Thus we feel that
length, we extend the alignment to length 32 by padding bases from the
the clustering for this data set cannot be improved within our
genome and then replace sequences of closely related species by their con-
scoring scheme. In short, our algorithm recovers almost half of all
sensus. This yields so-called mini-WMs, which are the objects that our algo-rithm clusters. When moved between clusters, a window of length 27 is
regulons for which binding sites are known and the large majority
of regulons for which there are more than three sites known.
We sampled P(C͉D) for the 2,397-site test set and found that, as
predicted, many clusters are lost (only 9 of 24 significant clusters
binding sites and missing some of the signal in long binding sites.
remain). Several of those that remain where reinforced by the
We symmetrically expand the alignments in our data set to
presence of additional unannotated sites in the supplemental set of
length 32, padding bases from the genomes (see Fig. 5). We
2,000. (Using more samples improves clusterability as we have seen
would like to treat these sequences as independent samples of a
in Classifiability vs. Clusterability.) For this larger data set, the total
single WM, but for closely related species this assumption
number of clusters fluctuates around 350 during the run, but
probably is untenable. For alignments from data set (11) we
only Ϸ5% of them are significant, which suggests that most E. coli
therefore replace sites from the triplet E. coli, Y. pestis, and S.
binding sites are in the unclusterable regime, and that comparative
typhimurium, and from the duplet H. influenzae and A. actino-
genomic information is essential to effectively cluster. We also
mycetemcomitans by their respective consensi. For the data set
(12) we only replace the triplet E. coli, K. pneumoniae, and S.
performed simulations with ‘‘surrogate’’ data sets that support this
typhimurium by their consensus. The mini-WMs thus obtained
claim further. For each cluster of known binding sites, we calculated
are the objects that our algorithm clusters. Finally, every time the
the information score I of its WM and created four random WMs
Monte Carlo algorithm reassigns a mini-WM to a cluster, it
with equal I. By drawing samples from each of these, we ‘‘scaled up’’
samples over the six different ways of picking a length 27 window
the set of known binding sites and clusters by a factor of 5 to
out of the length 32 alignment and over both strands (see
correspond to the estimated number of TFs in E. coli. In sampling
P(C͉D) for this set, we found that less than 10% of the clusters are
Before clustering these primary data sets we tested the
algorithm on a set of experimentally determined TF binding sites
For the larger data sets from (11) and (12), which are our main
in E. coli that was collected in ref. 1. We again extended (or
interest, repeated annealing and sampling runs indicated that both
cropped) these sequences symmetrically to length 32. After
the annealed state and the significance statistics are not converged
excluding factor sites and sites that overlap one another by 27
fully within our running times (1010 steps, taking a week on a
or more bases, there are 397 binding sites representing 53 TFs
workstation per run). We therefore extracted significant clusters via
remaining in this test set. See the supporting information for
pair statistics as described above, which did converge and allowed
comments on the preprocessing of this and our other data sets.
us to assign error bars to all pair statistics. For the data set (11) there
For data set (11) we removed all alignments that overlap
were 365 Ϯ 5 clusters on average, and the connectivity graph gave
known binding sites or repetitive elements and then took the top
274 components containing 1,139 out of 2,056 mini-WMs. Thus,
2,000 nonoverlapping alignments ordered by their score. For
about half of the data set clusters stably, whereas the other half
data set (12) we also took the top 2,000 nonoverlapping sites
moves in and out of the Ϸ100 unstable clusters. There were 115
based on significance, but we left sites overlapping known
significant clusters comprising 645 mini-WMs. Of the 115 signifi-
binding sites in this set. Finally, in order to separate new regulons
cant clusters, 21 contained as one of its member mini-WMs the
from new sites for TFs with sites in the collection (1), we aligned
alignment of a set of known binding sites for a TF from ref. 1. These
all known E. coli sites for each TF into its own mini-WM and
clusters thus contain new sites for known regulons. The other 94
added these 56 mini-WMs to sets (11) and (12) [3 out of the 53
clusters correspond to new putative regulons, some examples of
TFs (argR, metJ, and phoB) have two different types of sites,
which we align separately into mini-WMs]. Both these sets thus
It is interesting to calculate the cluster information scores, I,
to compute the fractions, eϪI, of sequence space occupied by our
We created an additional test set consisting of the 397 known
clusters. Summing these volumes, we find that Ϸ1% of the space
binding sites from ref. 1 and the E. coli sequences of the top 2,000
is filled by the top 45 clusters, the top 80 clusters fill 10% of the
unannotated mini-WMs from (11). As described below, this test
space, and all our 115 significant clusters fill 39% of the space,
verified our prediction that by embedding the 397 known sites in
which again supports the idea that the set of all WMs is close to
a larger set of sites, many clusters will fail to be inferred correctly.
the classification boundary; their binding sites fill almost the
We used the test set of 397 known binding sites in several ways. First,
For the data set (12) there are 275 Ϯ 4 clusters on average
we sampled P(C͉D) and measured, for each factor, how well its sites
during the sampling. The connectivity graph has 176 clusters
cluster. That is, we measured the coclustering distribution p(k) for
containing 726 mini-WMs. There were 65 significant clusters
each TF. Using the significance threshold described above, we
(containing 398 mini-WMs), of which 25 correspond to known
found significant clusters for 24 of the 53 TFs. Twenty two TFs have
regulons. With respect to the sequence space volume filled by the
three or fewer sites in the test set, and with the exception of trpR
WMs of these clusters, 1% of the space is filled by the first 30
their sites did not cluster significantly. As a better test of our
clusters, 50 clusters fill 10% of the space, and the full set of 65
algorithm, we compared the clusters inferred from annealing this
WMs fills Ϸ50% of the sequence space. 7326 ͉ www.pnas.org͞cgi͞doi͞10.1073͞pnas.112690399 Table 1. Sample clusters from data set 11 thiCEFGH tpbA͞yabKJ thiMD thiL idnK,idnDOTR gntKU gntT b2740 edd͞eda nrdAB nrdDG nrdHIEF coaA tgt͞yajCD͞secDF yegQ b3975 tpr yeeO yhbc͞nusA͞infB mutM arsRBC yhdNM nadA͞pnuC lig ptsHI͞crr rbfA͞truB͞rpsO glnK͞amtB cmk͞rpsA glnALG glnHPQ narGHJI hisJQMP thdF fabF recQ tsf pnp pyrE himD cydAB appCB yhhK,livKHMGF torCAD,torR ansB͞yggM ybbQ yiiE fabA b2899(yqfA) fabB fabHDG pcnB͞folK pssA dksA͞yadB yaeS mreCD͞yhdE͞cafA sanA cmk͞rpsA yaiB͞phoA͞psiF, ddlA dnaB͞alr creABCD iap avtA abc,yaeD cadBA araFGH,yecI celABCDF citAB,citCDEF agaBCD tauABCD fruR fruBKA epd yggR metK,yqgD ftn pykA yheA͞bfr
The cluster rank is by WM information score. The defining operons come in three categories: those with member sites in the data set
on which the algorithm was run (bold), those with sites in data set (11) that match the WM (normal font), and those that were foundby scanning the regulatory regions of E. coli (italics). Multiple genes within an operon are separated by a ͞or by multiple capitals at theend of the gene name. Operons separated by a comma indicate that the site fell between divergently transcribed genes. Examples
sites) and additional fis, dnaA, and unattributed sites upstream of
Table 1 contains a synopsis of some of predicted new regulons we
nrdA (22). The nrdA site in our cluster is located downstream of
have examined in detail from the data set 11. Primary cluster
transcription start. Because nrdA is down-regulated during anaer-
membership is noted along with additional sites that can be found
obiosis and nrdD is essential for anaerobic growth, we would guess
by scanning the cluster WM over the full data set and all regulatory
that our sites are involved in the switch.
regions of E. coli. The complete lists are on our web site (www.
The estimated WM of cluster 5 has a prominent inverted
physics.rockefeller.edu͞ϳerik͞website.html).
repeat sequence as its consensus (AAAAacCC***TT***GGG-
Our thiamin cluster is an example of a predicted regulon that
GgTTTTTT) and has over 20 matches in the genome. These
recently has been confirmed experimentally. A comprehensive
sites may correspond to an RNA secondary structure, possibly
review of thiamin biosynthesis in prokaryotes (16) places the
involved in attenuation. There is no clear predominant func-
genes from the three operons of our thiamin cluster (thiBPQ is
tional theme to the genes in our cluster 5. Noteworthy are sites
also called tbpA͞yabJK) into a single pathway, together with the
upstream of the arsenic resistance operon (arsRBC), the crr
GENETICS
four single genes: thiL, thiK, dxs (yajP), and thiI (yajK). A recent
regulator of a multidrug efflux pump, and the ydnM (zntR)
paper (17) shows that the three thiamin operons share a common
regulator for Pb(II), Cd(II), and Zn(II) efflux. Also, two genes
RNA stem–loop motif that is responsible for posttranscriptional
involved in DNA repair occur (MutM and lig).
regulation. It is precisely a portion of this motif that we cluster.
The sites in cluster 15 occur upstream of genes whose proteins are
A fragment of this structure also occurs just upstream of
involved in RNA modification (thdF and pnp), recombination
translation start in thiL. For the remaining genes, thiK, dxs, and
(recQ and himD), and translation (tsf). More strikingly, 6 of 7 of
thiI, there are no putative sites in data set (11).
these sites occur downstream of genes coding for ribosomal protein
Besides the main gluconate metabolism pathway, a second
subunits and one RNase. For five of these genes, there is evidence
pathway that utilizes input from the catabolism of
MATHEMATICS
(see the ecocyc database, ecocyc.org:1555͞server.html͞) that our
been reported recently (18) and corresponds to our second cluster.
site falls within a transcription unit, i.e. that the genes upstream and
The first two operons (idnK and idnDOTR) code for the enzymes
downstream of our site are cotranscribed. It seems likely that these
that import L-idonate and convert it to 6-P-gluconate. The operon
sites are involved in either attenuation or translational regulation. gntKU contains a gluconokinase, which catalyzes the same reaction
E. coli has a rich repertory of respiratory chains that are built
as the idnK protein, and a low-affinity gluconate permease. b2740
from a variety of electron donors and acceptors (see ref. 21, page
is a gene of unknown function that belongs to the family of
218). One of our clusters (16) involves two homologous cyto-
gluconate transporters. Finally, gntT is a high-affinity gluconate
chrome operons cydAB and appCB (cyxAB), which transfer
permease. Additional sites were found upstream of the edd͞eda
electrons to oxygen and are active mainly during anaerobic
operon that encode the key enzymes of the Entner–Doudoroff
conditions. The torACD operon (divergently transcribed with its
pathway (19). Ref. 18 suggests that idnR both up-regulates the
regulator torR) transfers electrons to trimethylamine N-oxide.
L-idonate catabolism genes and represses gntKU and gntT when
There is a third cytochrome complex, cyoABCD, with different
growing on L-idonate, suggesting that our sites may bind indR.
specificity that is not linked to this cluster. Other operons in this
However, there are two sites upstream of gntT that are annotated
cluster such as livKHMGF, which is involved in amino acid
as gntR sites (20), which are also part of our cluster.
import, and ansB, which catalyzes asparagine to aspartate con-
The pathway for ribonucleotide reduction to deoxyribonucleo-
version, seem unrelated but are divergently transcribed with
tides is pictured on page 591 of ref. 21 and includes the first two
genes of unknown function. However, refs. 23 and 21 (page 366)
operons of our like-named cluster. We did not find sites in the
suggest that ansB also can provide fumarate as a terminal
regulatory regions of the other two genes in this pathway (ndk, dcd).
electron acceptor. AnsB is up-regulated strongly during anaer-
Scanning of the genome with the WM inferred from the nrdAB and
obic conditions and has known crp and fnr sites. The ansB site
nrdDG sites reveals an additional three (weaker) sites upstream of
in our cluster is different from these sites.
the nrdHIEF operon. The nrdEF genes are annotated as a cryptic
Cluster number 17 corresponds to the fatty acid biosynthesis
ribonucleotide reductase. The regulation of our two primary oper-
regulon with TF yijC (fabR) that was identified in ref. 11. Our
ons (nrdAB and nrdDG) is known to be complex and includes an fnr
cluster contains the sites they found upstream of fabA and b2899.
site upstream of nrdD (which we correctly clustered with other fnr
Additionally, we found WM matches upstream of the related
PNAS ͉ May 28, 2002 ͉ vol. 99 ͉ no. 11 ͉ 7327
genes fabB and fabHDG. Other operons with lower quality sites
be contrasted with approaches (e.g., refs. 4 and 7), in which
in the cluster include the mglBAC operon (methyl-galactoside
‘‘promising’’ motifs are selected based on how unlikely it is for them
transport), clpX (component of clpP serine protease), and the
to occur under some null hypothesis of randomness.
By applying our algorithm to data sets (11, 12) of putative
We are unable to guess the functional role of the binding sites
regulatory sites extracted from enteric bacteria, we predicted
clustered in cluster number 25. Some of the genes have func-
Ϸ100 new regulons in E. coli, containing Ϸ500 binding sites, and
tionalities related to the cell envelope and membrane (pssA,
Ϸ150 binding sites for known TFs. The functionality of many of
yaeS, mreCD, and sanA), and some seem involved in replication
the predicted regulons is supported by the fact that their sites are
(dskA, cafE). However, these functions seem rather diverse.
found upstream of genes that are clearly related functionally.
For cluster 26, we find sites upstream of genes involved in
Even if there is no common theme in the annotation of the genes
peptidoglycan biosynthesis (alr, ddlA, avtA, and mrcB) and
controlled by the sites, our significance measures suggest that a
genes that are known to be regulated in response to phosphate
large fraction of the clusters is functional; the data sets contain
starvation (creABC, iap, and phoA͞psiF). In particular, alkaline
only conserved sites upstream of orthologous genes in different
phosphatase (phoA) is upregulated more than 1,000-fold and
organisms, and a highly significant association of groups of such
accounts for as much as 6% of the protein content of the cell
sites was found. We note that our set is a considerable augmen-
during phosphate starvation (see ref. 21, page 1,361). Because
tation of the Ϸ400 non- sites that are known experimentally.
alkaline phosphatase is active in the periplasm, it seems con-
Analysis of some of our clusters shows that included in our
ceivable that peptidoglycan synthesis is down-regulated when
predicted regulons in addition to TF binding sites are RNA stems
phoA is expressed at such high levels.
controlling translation and even termination motifs.
Additional clusters with obvious common functionality include
The clusters and sites resulting from our genome-wide analysis
cluster 85 for Fe-S radical synthesis (24) and the large cluster 37,
of regulatory motifs allows for a more quantitative evaluation of
which contains several phosphotransferase system and other trans-
the global structure of regulatory networks in bacteria. The
port systems. Cluster 71 contains sites that overlap binding sites for
regulatory network is often imagined as a rather loosely coupled
the fructose repressor fruR. These sites were clustered separately
collection of ‘‘modules’’ where each regulon controls a set of
from the known fruR sites because of a systematic shift, larger than
genes with closely linked functionality (although of course many
the range our algorithm scans, between how they were given in data
exceptions exist such as the structural TFs fis, ihf, etc.). Our
set (11) and the annotated fruR sites. Similarly, cluster 11 contains
predicted regulons are often much less orderly. In several cases,
sites that overlap binding sites for the nitrogen fixation regulator
some but not all genes of a well studied pathway entered the
regulon. In other cases, a regulon contains sets of sites for genes
Apart from the 94 putative regulons, our web site has an
of two or three clearly distinct functionalities for which no
additional 270 sites that cluster with WMs of known TFs.
regulatory connection is known. Our overall impression is of a
Summing their membership probabilities, this corresponds to an
more haphazard regulatory network than traditionally imagined.
expected 135 binding sites. The web site also provides informa-
Finally, we have emphasized the distinction between classifying
tion for each E. coli gene separately: inferred regulatory sites
and clustering a set of binding sites. We have argued that the TFs
upstream of the gene and the cluster memberships of these sites.
of a cell are essentially solving a classification task, and that inferring
The clusters inferred from data set (12) are also on our web
regulons from the set of binding sites of a single genome may well
site. We have not evaluated their functional significance yet, but
be impossible in principle. There are also evolutionary arguments
some of them correspond to clusters that we also found in the
that support this claim. Like any piece of DNA, binding sites are
data of data set (11), e.g., the thiamin cluster reappears.
subject to random mutations. The more specific binding sites are,
the more likely they are to be disrupted by mutations. Evolution
Discussion
thus will naturally drive TFs and their binding sites to become as
We introduced a new inference procedure for probabilistically
unspecific as possible (25, 26) within the constraints set by their
partitioning a set of DNA sequences into clusters. Currently, the
function. That is, evolution will drive the set of binding sites toward
algorithm assumes all WMs to be of a fixed length, but prior
the ‘‘classification threshold’’ where they become unclusterable.
information about site lengths, their dimeric nature, and the length
The situation is reminiscent of the situation in communication
of spacers between dimeric sites could be included easily. One also
theory, where optimally coded messages look entirely random to
could extend the hypothesis space on which the algorithm operates;
receivers that are not in possession of the code. Information from
one may assume that only some fraction, rather than all, of the
comparative genomics thus is essential for the inference of regulons
sequences are WM samples, whereas the rest should described by
from genomic data, and as the number of sequenced genomes
a background model, which would, for instance, be appropriate for
grows, so will our algorithm’s ability to discover new regulons.
analyzing entire upstream regions. In all these generalizations, the
algorithm would still assign probabilities to sets of sequences
The support of National Science Foundation Grant DMR-0129848 is
belonging to a single TF. This essentially Bayesian approach should
1. Robison, K., McGuire, A. M. & Church, G. M. (1998) J. Mol. Biol. 284, 241–254.
15. Metropolis, N., Rosenbluth, A. W., Rosenbluth, M. N., Teller, A. H. & Teller, E. (1953)
2. Salgado, H., Santos-Zavaleta, A., Gama-Castro, S., Millan-Zarate, D., Blattner, F. &
J. Chem. Phys. 21, 1087–1092.
Collado-Vides, J. (2000) Nucleic Acids Res. 28, 65–7.
16. Begley, T., Downs, D., Ealick, S., McLafferty, F., van Loon, A., Taylor, S., Campobasso, N.,
3. Salgado, H., Moreno-Hagelsieb, G., Smith, T. & Collado-Vides, J. (2000) Proc. Natl. Acad.
Chiu, H. J., Kinsland, C., Reddick, J. J. & Xi, J. (1999) Arch. Microbiol. 171, 293–300. Sci. USA 97, 6652–6657.
17. Miranda-Rios, J., Navarro, M. & Sobero´n, M. (2001) Proc. Natl. Acad. Sci. USA 98, 9736–9741.
4. Stormo, G. D. & Hartzell, G. W. (1989) Proc. Natl. Acad. Sci. USA 86, 1183–1187.
18. Bausch, C., Peekhaus, N., Utz, C., Blais, T., Murray, E., Lowary, T. & Conway, T. (1998)
5. Lawrence, C. E., Altschul, S. F., Boguski, M. S., Liu, J. S., Neuwald, A. F. & Wootton, J. C. J. Bacteriol. 180, 3704–3710.
(1993) Science 262, 208–214.
19. Peekhaus, N. & Conway, T. (1998) J. Bacteriol. 180, 3495–3502.
6. Bailey, T. & Elkan, C. (1994) Proc. Int. Conf. Intell. Syst. Mol. Biol. 2, 28–36.
20. Peekhaus, N. & Conway, T. (1998) J. Bacteriol. 180, 1777–1785.
7. Bussemaker, H. J., Li, H. & Siggia, E. D. (2000) Proc. Natl. Acad. Sci. USA 97, 10096–10100.
21. Neidhardt, F. C., ed. (1996) Escherichia coli and Salmonella Typhimurium: Cellular and
8. Hardison, R., Oeltjen, J. & Miller, W. (1997) Genome Res. 10, 959–966. Molecular Biology (Am. Soc. Microbiol., Washington DC).
9. Gelfand, M., Koonin, E. & Mironov, A. (2000) Nucleic Acids Res. 28, 695–705.
22. Jacobson, B. A. & Fuchs, J. A. (1998) Mol. Microbiol. 28, 1315–1322.
10. McGuire, A. M., Hughes, J. D. & Church, G. M. (2000) Genome Res. 10, 744–757.
23. Jennings, M. & Beacham, I. (1990) J. Bacteriol. 172, 1491–1498.
11. McCue, L. A., Thompson, W., Carmack, C. S., Ryan, M. P., Liu, J. S., Derbyshire, V. &
24. Cheek, J. & Broderick, J. (2001) J. Biol. Inorg. Chem. 6, 209–226.
Lawrence, C. E. (2001) Nucleic Acids Res. 29, 774–782.
25. van Nimwegen, E., Crutchfield, J. P. & Huynen, M. (1999) Proc. Natl. Acad. Sci. USA 96,
12. Rajewsky, N., Socci, N. D., Zapotocky, M. & Siggia, E. D. (2002) Genome Res. 12, 298–308.
13. Berg, O. G. & von Hippel, P. H. (1987) J. Mol. Biol. 193, 723–750.
26. Sengupta, A. M., Djordjevic, M. & Shraiman, B. I. (2002) Proc. Natl. Acad. Sci. USA 99,
14. de Bruijn, N. G. (1958) Asymptotic Methods in Analysis (Dover, New York). 7328 ͉ www.pnas.org͞cgi͞doi͞10.1073͞pnas.112690399
Overview: Bronchial Asthma can be: - Mild - Moderate - Sever (Status Asthmaticus) Also can be divided into acute or chronic. Another classification into Atopic (Extrinsic) or Non-Atopic (Intrinsic). C/F: Common features of asthma in general: They are the symptoms/signs of airway narrowing/obstruction/inflammation/mucus production & their sequels: • Dyspnea (with or without
Dagboek Albanië Donderdag 7 november 2002 Minder dan twee maanden geleden kwam ik terug Elbasan. Nu ben ik weer op weg en het is nodig. Er zijn veel, te veel dingen te doen. ECE is een probleem, maar er zijn ook verheugende ontwikkelingen. In Amsterdam regent het, in Budapest is het koud en in Tirana schijnt een heerlijk najaarszonnetje. Het kost je minder dan vijf uur om in een andere wer
 Two ways of partitioning the same set of sequences into clusters. The
rectangle schematically represents the space of all possible DNA sequences ofsome particular length l. The dots denote the sequences in the data set, andthe circles indicate which sequences are partitioned together into clusters.
Two ways of partitioning the same set of sequences into clusters. The
rectangle schematically represents the space of all possible DNA sequences ofsome particular length l. The dots denote the sequences in the data set, andthe circles indicate which sequences are partitioned together into clusters.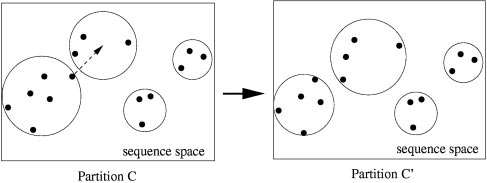
 Monte Carlo sampling of partitions: example of a move from partition
C to partition CЈ. The dots are sequences, and the circles delineate the clusters.
Monte Carlo sampling of partitions: example of a move from partition
C to partition CЈ. The dots are sequences, and the circles delineate the clusters.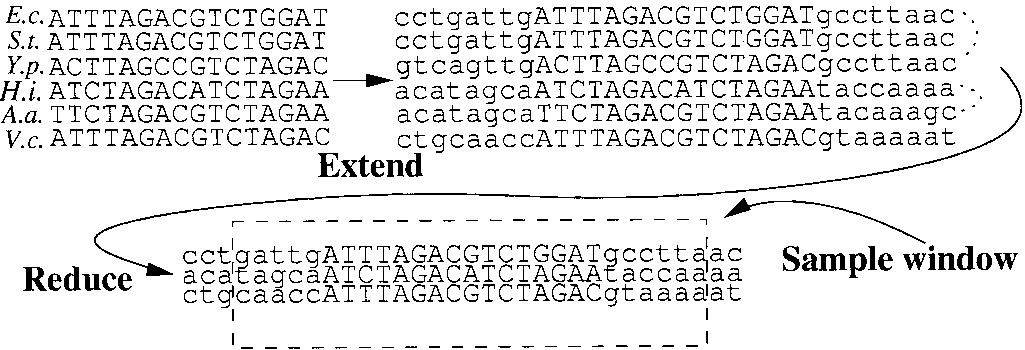 data set with the site annotation. We performed two annealing runs
to identify an ML partition and then performed sampling runs to
test the significance of these ML clusters. We found that, in general,
there is good agreement between the annotation and the clusters
inferred by annealing. For 17 of the 24 TFs that form significant
clusters there was an analogous significant cluster obtained by the
annealing. The full results are in supporting information. We have
found also that the likelihood P(C͉D) for the partition obtained in
all annealing runs is significantly higher than that obtained when the
Operations on the data sets. Starting from an alignment of variable
sites are partitioned according to their annotation. Thus we feel that
length, we extend the alignment to length 32 by padding bases from the
the clustering for this data set cannot be improved within our
genome and then replace sequences of closely related species by their con-
scoring scheme. In short, our algorithm recovers almost half of all
sensus. This yields so-called mini-WMs, which are the objects that our algo-rithm clusters. When moved between clusters, a window of length 27 is
regulons for which binding sites are known and the large majority
of regulons for which there are more than three sites known.
data set with the site annotation. We performed two annealing runs
to identify an ML partition and then performed sampling runs to
test the significance of these ML clusters. We found that, in general,
there is good agreement between the annotation and the clusters
inferred by annealing. For 17 of the 24 TFs that form significant
clusters there was an analogous significant cluster obtained by the
annealing. The full results are in supporting information. We have
found also that the likelihood P(C͉D) for the partition obtained in
all annealing runs is significantly higher than that obtained when the
Operations on the data sets. Starting from an alignment of variable
sites are partitioned according to their annotation. Thus we feel that
length, we extend the alignment to length 32 by padding bases from the
the clustering for this data set cannot be improved within our
genome and then replace sequences of closely related species by their con-
scoring scheme. In short, our algorithm recovers almost half of all
sensus. This yields so-called mini-WMs, which are the objects that our algo-rithm clusters. When moved between clusters, a window of length 27 is
regulons for which binding sites are known and the large majority
of regulons for which there are more than three sites known.