Aortic Pressure Augmentation Predicts Adverse Cardiovascular Events in Patients With Established Coronary Artery Disease
Julio A. Chirinos, Juan P. Zambrano, Simon Chakko, Anila Veerani, Alan Schob, Howard J. Willens,
Abstract—Pulse pressure (PP), a marker of arterial stiffness, predicts cardiovascular risk. We aimed to determine whether
augmentation pressure (AP) derived from the aortic pressure waveform predicts major adverse cardiovascular events (MACE) and death independently of PP in patients with established coronary artery disease (CAD). We prospectively followed-up 297 males undergoing coronary angiography for 1186Ϯ424 days. Ascending aortic pressure tracings obtained during catheterization were used to calculate AP (difference between the second and the first systolic peak). Augmentation index (AIx) was defined as AP as a percentage of PP. We evaluated whether AP and AIx can predict the risk of MACE (unstable angina, acute myocardial infarction, coronary revascularization, stroke, or death) and death using Cox regression. All models evaluating AP included PP to assess whether AP adds to the information already provided by PP. Both AP and AIx significantly predicted MACE. The hazard ratio (HR) per 10 mm Hg increase in AP was 1.20 (95% confidence interval [CI], 1.08 to 1.34; PϽ0.001); the HR for each 10% increase in AIx was 1.28 (95% CI, 1.11 to 1.48; Pϭ0.004). After adjusting for other univariate predictors of MACE, age, and other potential confounders, AP remained a significant predictor of MACE (HR per 10 mm Hg increaseϭ1.19; 95% CI, 1.06 to 1.34; Pϭ0.002), as did AIx (adjusted HR, 1.28; 95% CI, 1.09 to 1.50; Pϭ0.003). AP was a significant predictor of death (HR per 10 mm Hg increaseϭ1.18; 95% CI, 1.02 to 1.39; Pϭ0.03). Higher AIx was associated with a trend toward increased mortality (HRϭ1.22; 95% CI, 0.98 to 1.52; Pϭ0.056). Aortic AP predicts adverse outcomes in patients with CAD independently of PP and other risk markers. (Hypertension. 2005;45:980-985.) Key Words: arterial stiffness Ⅲ cardiovascular events Ⅲ coronary angiography
Ⅲ coronary artery disease Ⅲ prospective study
Increasedarterialstiffnesshasbeenshowntocorrelatewith augmentation index (AIx). AIx has been shown to be predic-
coronary risk factors.1–4 In addition, measures of arterial
tive for the presence of CAD5–7 and has been shown to predict
stiffness correlate with the presence of angiographic coronary
adverse outcomes in patients with end-stage renal disease.11
artery disease (CAD).5–7 An increased pulse pressure (PP),
However, whether central pressure augmentation can predict
which has been associated with increased arterial stiffness, is
adverse outcomes independently of PP and angiographic
an adverse cardiovascular risk predictor.8–10 The pressure
severity of CAD in patients with established coronary disease
waveform of the proximal aorta is affected by arterial
stiffness and likely to be more informative than the pulse
In this study, we aimed to determine whether AP and AIx
can predict the incidence of major adverse cardiovascular
The central aortic pressure wave is composed of a forward-
events (MACEs) or all-cause mortality in patients with
traveling wave generated by left ventricular ejection and a
later-arriving reflected wave from the periphery.1–4 As aorticand arterial stiffness increase, transmission velocity of both
forward and reflected waves increase, which causes the
Study Population
reflected wave to arrive earlier in the central aorta and
We studied a cohort of 420 male veterans undergoing clinically
augment pressure in late systole. Therefore, augmentation of
indicated coronary angiography at the Miami Veterans Administra-tion Medical Center between October 1998 and February 2000. The
the central aortic pressure wave is a manifestation of wave
study was approved by the Hospital’s Institutional Review Board and
reflection. This can be expressed in absolute terms as the
written informed consent was obtained from all patients. For this
augmented pressure (AP), or as a percentage of PP as the
study, only subjects with coronary artery stenosis on angiography of
Received January 18, 2005; first decision February 3, 2005; revision accepted March 14, 2005. From the University of Miami School of Medicine (J.A.C., J.P.Z., S.C., A.V., A.S., H.J.W., G.P., A.J.M.), Diabetes Research Institute (A.J.M.), and
Veterans Affairs Medical Center (S.C., A.S., H.J.W.), Miami, Fla.
Correspondence to Julio A. Chirinos, MD, 111-A, V.A. Medical Center, 1201 NW 16th Street, Miami, FL 33125. E-mail jchirinos@med.miami.edu 2005 American Heart Association, Inc. Hypertension is available at http://www.hypertensionaha.org DOI: 10.1161/01.HYP.0000165025.16381.44 980 Chirinos et al Pressure Augmentation and Cardiovascular Risk 981
and reflected wave, which occurred in 27.9% of cases), an augmen-tation pressure of zero was assigned. To assess the reproducibility ofmanual calculation of the AIx, 12 consecutive beats were analyzed in15 patients. The average coefficient of variation in these analyseswas 8.8%.
Because arterial elasticity is not constant but instead depends on
its distending pressure, the mean arterial pressure (MAP) wasincorporated into all models including AP or AIx, so that anticipatedeffects of distending pressure can be differentiated from real differ-ences in the elasticity of the arterial wall.13 Similarly, AIx reflects theinteraction between ventricular ejection and the properties of the
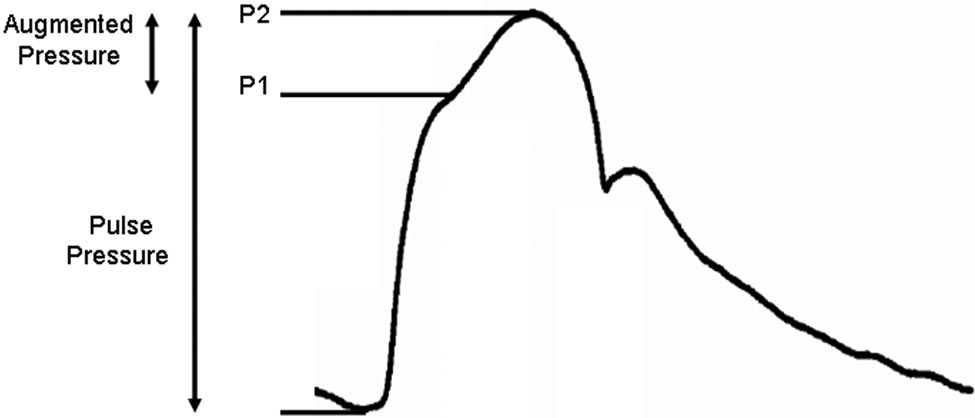
Figure 1. Representation of a central aortic pressure waveform
arteries,6,14 and it can be affected by changes in left ventricular
and calculation of the augmentation pressure and pulse pres-
systolic function. Heart rate can also influence pulse wave velocity
sure. The augmentation index is the augmentation pressure
and central pressure augmentation.14–16 Therefore, the EF and heart
expression as a proportion of the pulse pressure.
rate (RR interval preceding the cardiac cycle in which the AP wascalculated) were included in all models evaluating AP or AIx. In
Ͼ10% were included and those with more than mild valvular heart
addition, PP was included in all models evaluating AP. By means of
adding AP to models already containing PP, one can estimate hazard
A full demographic and clinical characterization was performed at
ratios (HRs) for different levels of AP after adjustment for PP and,
study entry. Data recorded included age, ethnicity, height, weight,
importantly, test whether the addition of AP to a model already
peripheral blood pressure, ejection fraction (EF) (measured byventriculography at the time of coronary angiography or echocardi-
Baseline Characteristics of Study Subjects
ography within 1 month of the date of cardiac catheterization),current smoking, previous myocardial infarction, history of periph-
eral vascular disease, congestive heart failure, diabetes mellitus,stroke, or revascularization procedures (coronary artery bypass
surgery or percutaneous coronary intervention), and family history of
CAD. The indication for cardiac catheterization and the medications
that patients were receiving at that time were also recorded. Brachialblood pressure values were based on a single cuff pressure taken in
the recumbent position the morning before cardiac catheterization. Angiographic Studies Coronary angiography was performed and images of the coronary
tree were obtained in routine standardized projections. The number
of coronary vascular territories with at least one 50% or greater
diameter stenosis before percutaneous or surgical coronary revascu-larization was used as an index of CAD severity (0-vessel, 1-vessel,
2-vessel, or 3-vessel disease). Left main lesions were categorized as
Laboratory Analysis
Peripheral blood samples were collected just before the cardiac
catheterization. Blood was allowed to clot for 30 minutes at room
Aortic diastolic blood pressure, mm Hg (IQR)
temperature and serum collected after centrifugation. Serum sampleswere stored in aliquots at Ϫ80°C until analyzed. Total cholesterol
and triglycerides (Roche Diagnostics) and high-sensitivity
C-reactive protein (Dade-Behring) levels were determined. High-
density lipoprotein lipids were measured after precipitation ofapolipoprotein B– containing lipoproteins.12 Very-low-density li-
poprotein and low-density lipoprotein cholesterol were estimated by
Pulse Waveform Analysis
Central aortic pressure was recorded invasively via a low-
compliance fluid-filled catheter positioned in the ascending aorta. The system was inspected for the presence of bubbles or clots before
pressure recordings. Only waveforms that were technically adequate
on visual inspection were included in the analysis; waveform
analysis was performed manually. The analyzer of the pressurewaveforms was blinded to the outcome and all clinical and labora-
tory variables. Similarly, the assessment of outcomes during
follow-up was blinded to variables derived from waveform analysis.
The merging point of the incident and the reflected wave (inflectionpoint) was identified on the aortic pressure waveform. The first and
second systolic peaks (P and P ) of the aortic pressure waveform
were analyzed (Figure 1). AP was calculated as the difference
between the second and first systolic peaks (P ϪP ). AIx was defined
as AP expressed as a percentage of PP. When the inflection point
CRP, C-reactive protein; IQR, interquartile range; LDL, low-density lipopro-
could not be identified (because of superimposition of the incident
982 Hypertension Univariate Predictors of Major Adverse Cardiovascular Events (n؍297) Figure 2. Augmentation pressure and augmentation index as
containing PP significantly improves the predictive ability of the
predictors of major adverse cardiovascular outcomes. Hazard
model (ie, whether AP adds significant prognostic information to
ratios and 95% confidence intervals for each 10-mm Hg
that already provided by PP). Finally, given that age and height affect
increase in augmentation pressure (adjusted for pulse pressure)or 10% increase in augmentation index (AIx). Both augmentation
wave reflections, these variables were included among the potential
pressure and AIx were adjusted for mean aortic pressure, heart
confounders in multivariate analyses.
rate, and ejection fraction in all models. Model 2 also includedunivariate predictors of major adverse cardiovascular events
Definitions of Events and Follow-Up
shown in Table 2. Model 3 included variables in model 2, age,
Events were documented by patient interview and review of elec-
height, and other potential confounders (angiotensin-converting
tronic hospital records. The primary combined endpoint was the first
enzyme inhibitor, -blocker, statin use, high-density lipoprotein
occurrence of any of the following MACEs: death from any cause,
cholesterol, and low-density lipoprotein cholesterol).
myocardial infarction, unstable angina, revascularization with eitherpercutaneous coronary intervention or coronary artery bypass graft
were lost to follow-up and 1 patient died 1 day after cardiac
surgery (if these procedures were not a direct result of the angio-
catheterization and was excluded from the analysis. The final
graphic findings during the index cardiac catheterization), andstroke. The secondary endpoint was death from any cause. The
analysis was performed with data from 297 patients. The
diagnosis of myocardial infarction was performed by the presence of
baseline characteristics of our patient population are shown in
suggestive symptoms, with either electrocardiographic evidence
(new Q waves in 2 or more leads) or cardiac marker evidence ofinfarction, according to the standard Thrombolysis In Myocardial
Predictors of MACE
Infarction (TIMI) and American College of Cardiology definition.
The mean follow-up among patients who did not have a
Unstable angina was defined as ischemic discomfort at rest for atleast 10 minutes prompting rehospitalization, combined with one of
MACE was 1186Ϯ424 days. During the follow-up period,
the following: ST-segment or T-wave changes, cardiac marker
43.1% of patients had a MACE. Univariate predictors of
elevations that were above the upper limit of normal but did not meet
the criteria for myocardial infarction, or a second episode ofischemic chest discomfort lasting Ͼ10 minutes and that was distinct
Augmentation Pressure and MACE
from the episode that had prompted hospitalization.
Absolute augmentation pressure significantly predictedMACE (Figure 2). There was a 20% increase in the risk of
Statistical Analysis
MACE for every 10 mm Hg increase in augmentation pres-
Normally distributed continuous variables are expressed asmeanϮstandard deviation. Non-normally distributed continuous
sure (95% confidence interval [CI], 8% to 34%; PϽ0.001).
variables are expressed as median (interquartile range). Proportions
This indicates that AP added significant prognostic informa-
are expressed as counts and percentages. Univariate and multivariate
tion to that already provided by PP. After adjusting for
survival analyses were performed with Cox regression. Analyses
univariate predictors of MACE (Table 2), AP significantly
were performed separately for MACE and all-cause mortality.
predicted MACE (adjusted HR per 10 mm Hg in-
Multivariate analysis was performed incorporating all univariate
creaseϭ1.19; 95% CI, 1.07 to 1.33; Pϭ0.001). After also
predictors of the outcome and other potential confounders. Allprobability values are 2-tailed. Values of PϽ0.05 were considered
adjusting for age, height, and other potential confounders
statistically significant. All analyses were performed with the statis-
(angiotensin-converting enzyme inhibitor, -blocker, statin
tical package NCSS for Windows (Kaysville, Utah).
use, high-density lipoprotein cholesterol, and low-densitylipoprotein cholesterol), AP remained a significant predictor
of MACE (adjusted HR per 10 mm Hg increaseϭ1.19; 95%
Among the 420 patients who signed the informed consent,
360 had CAD. Nine patients were excluded from this studysecondary to significant valvular disease. Out of the 351
AIx as a Predictor of MACE
remaining patients, acceptable pressure waveforms on visual
AIx significantly predicted the risk of MACE (Figure 2).
inspection were available in 312 subjects. Fourteen patients
There was a 28% increase in the risk of MACE for every 10%
Chirinos et al Pressure Augmentation and Cardiovascular Risk 983 Univariate Predictors of All-Cause Mortality (n؍297) AP and Death AP was a significant predictor of death. For every 10-mm Hg
increase in AP, there was an 18% increase in the risk of death
(95% CI, 2% to 39%; Pϭ0.03). When adjusted for univariate
predictors of death (Table 3), an increased AP was associated
with a trend toward increased mortality (HR for 10 mm Hg
increase: 1.16; 95% CI, 0.99 to 1.35; Pϭ0.06). AIx and Death
Higher AIx (adjusted for EF, HR, and mean arterial blood
pressure) was associated with a trend toward increased
mortality (HRϭ1.22; 95% CI, 0.98 to 1.52; Pϭ0.056). When
adjusted for univariate predictors of death, the adjusted HR
per 10% increase in AIx was 1.01; the correlation did notreach statistical significance (PAortic Pressures and Death
Aortic diastolic blood pressure inversely correlated with therisk of death (HR per 10-mm Hg increaseϭ0.74; 95% CI,
increase in AIx (95% CI, 11% to 48%; PϽ0.001). After
0.60 to 0.93; Pϭ0.01). When adjusted for EF and MAP, PP
adjusting for univariate predictors of MACE (Table 2), AIx
predicted mortality (adjusted HR per 10-mm Hg increase in
remained a significant predictor of MACE (adjusted HR per
PPϭ1.17; 95% CI, 1.03 to 1.32; Pϭ0.01). Brachial PP did
10% increaseϭ1.27; 95% CI, 1.10 to 1.48; Pϭ0.001). After
also adjusting for age, height, other potential confounders(angiotensin-converting enzyme inhibitor, -blocker, statin
Discussion
use, high-density lipoprotein cholesterol, and low-density
We investigated whether AP, a marker of aortic stiffness and
lipoprotein cholesterol), the correlation between AIx and
wave reflection from the periphery, predicts adverse cardio-
MACE persisted (adjusted HRϭ1.28; 95% CI, 1.09 to 1.50;
vascular outcomes in patients with established CAD. We
found a significant independent correlation between AP(adjusted for PP) and the risk of MACE. This indicates that
Aortic Pressures and MACE
AP added significant prognostic information to that already
Interestingly, centrally measured diastolic blood pressure was
provided by PP and other risk markers and potential con-
a predictor of MACE; for every 10 mm Hg increase in aortic
founders. Similar results were obtained when AIx a single
diastolic blood pressure, the HR was 0.83 (95% CI, 0.71 to
composite term was analyzed. AP predicted all-cause mortal-
0.96; Pϭ0.01), indicating that lower aortic diastolic blood
ity; when additional adjustments were performed, including
pressure values were associated with a higher risk of MACE
age and other predictors of death, a trend for increased death
in our population. As expected, aortic diastolic blood pressure
with increased AP persisted. A trend toward prediction of
closely correlated with mean aortic blood pressure (rϭ0.71;
death was found when AIx was adjusted for heart rate, EF,
PϽ0.0001); therefore, we did not include aortic diastolic
and MAP, but not when further adjustment was performed for
blood pressure in the models described (which included the
other predictors of mortality. These results raise the possibil-
MAP) to avoid problems with colinearity. To test whether AP
ity that AIx, although practical as a single composite value,
or AIx predict MACE independently of aortic diastolic blood
might not contain all the prognostic information contained in
pressure, both aortic systolic blood pressure and aortic
both values (AP and PP) expressed separately. Our study has
diastolic blood pressure were entered in the model and mean
not proven this concept, which needs to be tested in other
aortic blood pressure was withdrawn (aortic systolic and
populations and confirmed by means of prospective
diastolic pressures did not closely correlate in our popula-
tion). In these models, the adjusted HR for each 10% increase
Although peripheral PP is the most commonly measured
in AIx was 1.33 (95%CI: 1.14 to 1.55; Pϭ0.0002); the
marker of arterial stiffness, the information contained within
adjusted HR for each 10-mm Hg increase in AP was 1.23
the waveform of the proximal aorta is of particular interest
(95%CIϭ1.10 to 1.37; Pϭ0.0002).
because the blood pressure profile at this site determines left
After adjusting for EF and MAP, there was a trend for an
ventricular load and coronary blood flow.13 AP results form
increased risk of MACE with increasing aortic PP (HR per
the pressure wave generated by the left ventricle, conducted
10 mm Hg increase in PP: 1.084; 95% CI, 0.997 to 1.178;
by large arteries, and reflected at peripheral impedance small
Pϭ0.057). Brachial PP did not predict MACE in our
arteries and arterioles (and conducted back by large arteries to
the proximal aorta). Therefore, central pressure augmentationis affected by large-artery stiffness as well as the tone of
Predictors of All-Cause Mortality
impedance vessels, which, in turn, is influenced by the tone of
During the follow-up period, 19.5% of patients died. Univar-
arterial smooth muscle. It has been shown that nitric oxide
iate predictors of death are shown in Table 3.
contributes to the functional regulation of stiffness.17–19 By
984 Hypertension
affecting the timing and magnitude of wave reflection,
which subjects with isolated systolic hypertension were
increased arterial stiffness has the potential to directly impair
treated with chlorthalidone and atenolol (versus placebo) in a
coronary blood flow in patients with CAD.20–22 Interestingly,
stepwise manner;36 in this trial, a decrease of 5 mm Hg in
high carotid AIx has been shown to be an independent
diastolic blood pressure was associated with an increase in
predictor of cardiac ischemic threshold during exercise in
the risk of major adverse cardiovascular events (HRϭ1.11;
patients with CAD.22 Therefore, AP is determined by the
95% CI, 1.05–1.16). Our findings are also consistent with a
cumulative and integrated influence of various structural,
recent preliminary from the large International Verapamil
hemodynamic, and metabolic stimuli and can ultimately
SR/trandolapril (INVEST) Study.37 Whether the correlation
impair coronary blood flow. Arterial stiffness might be not
of diastolic blood pressure with adverse outcomes in patients
only a risk marker but also a therapeutic target for patients at
with CAD is related to increased arterial stiffness, comorbid
risk for CAD, as well as for patients with established CAD.
conditions, or a combination of both remains unclear. The
Importantly, noninvasive recordings of radial arterial pressure
association of diastolic blood pressure and the risk of MACE
waveforms using radial tonometry and a generalized transfer
in our population and the way it relates to arterial stiffness
function now allow for determinations of central pressure
and comorbid conditions is the focus of a separate analysis.
Our study is in agreement with previous studies that have
Perspectives
shown that measures of arterial stiffness predict adverse
Several studies indicate that markers of arterial stiffness are
cardiovascular outcomes in different populations,11,25–33 such
reliable predictors of cardiovascular events in the wide
as patients with end-stage renal disease,11,25,26 hyperten-
spectrum of atherosclerosis progression. Measures of arterial
sion,27–29 diabetes mellitus,30 and patients older than 70
stiffness can identify nonhypertensive subjects at risk for
years,31 all of which are populations at high risk for CAD.
hypertension, identify hypertensive, diabetic, and elderly
Adding to this line of evidence, we have shown that increased
subjects who are at increased risk for vascular events and
AP predicted adverse cardiovascular outcomes in patients
death, predict mortality in patients with established renal
with established CAD independently of age, the angiographic
disease, and predict adverse cardiovascular outcomes in
severity of CAD, and other risk markers. It should be noted,
patients with established angiographic coronary artery dis-
however, that changes in AP may be partially independent of
ease. The technology to noninvasively evaluate arterial stiff-
changes in arterial stiffness. The factors that determine
ness and wave reflections is available and suitable for clinical
central pressure augmentation are diverse, complex, and
use. Further studies are needed to further quantify the extent
incompletely understood. Central pressure augmentation
to which measures of arterial stiffness can improve risk
likely represents a composite marker of disease-related ad-
stratification and, most importantly, to determine whether its
verse changes in hemodynamics that vary throughout differ-
reduction is capable of independently predicting clinical
ent sections of the arterial tree and deserve further mechanis-
benefit of therapeutic interventions in different populations.
Our study has limitations. We did not test the frequency–
Acknowledgments
amplitude performance of the catheterization laboratory am-
This work was funded by support from the American Heart Asso-
plifiers, which might affect the accuracy of measurements of
ciation, grant in aid (grant 9950534N to A.J.M.), and The Retirement
augmentation pressure. In addition, left ventricular dysfunc-
tion is a poor prognostic indicator that tends to decreasepressure augmentation. Although we performed adjustments
References
for EF in all models, these adjustments might not account for
1. O’Rourke MF, Staessen JA, Vlachopoulos C, Duprez D, Plante GE.
changes on the pattern of ventricular ejection. We should note
Clinical Applications of Arterial Stiffness; Definitions and ReferenceValues. Am J Hypertens. 2002;15:426 – 444.
that these limitations would be expected to obscure the
2. Nichols WW, Singh BM. Augmentation index as a measure of peripheral
predictive ability of AP rather than to underlie the correlation
vascular disease state. Curr Opin Cardiol. 2002;17:543–551.
between pressure augmentation and outcomes. Finally, sta-
3. Izzo JL Jr. Arterial stiffness and the systolic hypertension syndrome. Curr
tistical modeling for medication use might not incorporate the
4. McVeigh GE. Pulse Waveform Analysis and Arterial Wall Properties.
effect of individual agents prescribed in different doses. Hypertension. 2003;41:1010 –1011.
Careful analysis of the frequency–amplitude performance
5. Hayashi T, Nakayama Y, Tsumura K, Yoshimaru K, Ueda H. Reflection
of the entire measurement system is recommended for those
in the arterial system and the risk of coronary heart disease. Am J
who wish to undertake similar work. This can be achieved
Hypertens. 2002;15:405– 409.
6. Weber T, Auer J, O’Rourke MF, Kvas E, Lassnig E, Berent R, Eber B.
with the use of electrical pressure generators capable of
Arterial stiffness, wave reflections, and the risk of coronary artery
generating pressure waves in a liquid system at different
disease. Circulation. 2004;109:184 –189.
frequencies, as performed by Smulyen et al,34 or using the
7. Imanishi R, Seto S, Toda G, Yoshida M, Ohtsuru A, Koide Y, Baba T,
“pop-test” method as previously described.
Yano K. High brachial-ankle pulse wave velocity is an independent
predictor of the presence of coronary artery disease in men. Hypertens
The inverse association of centrally measured diastolic
blood pressure with the risk of MACE in our population
8. Madhavan S, Ooi WL, Cohen H, Alderman MH. Relation of pulse
deserves further mention. We found that lower aortic diastolic
pressure and blood pressure reduction to the incidence of myocardial
blood pressure were associated with a higher risk of MACE
infarction. Hypertension. 1994;23:395– 401.
9. Fang J, Madhavan S, Cohen H, Alderman MH. Measures of blood
and death. These findings are consistent with those from the
pressure and myocardial infarction in treated hypertensive patients.
Systolic Hypertension in the Elderly Program (SHEP) trial, in
J Hypertens. 1995;13:413– 419. Chirinos et al Pressure Augmentation and Cardiovascular Risk 985
10. Benetos A, Safar M, Rudnichi A, Smulyan H, Richard JL, Ducimetieere
23. O’Rourke MF, Pauca A, Jiang XJ. Pulse wave analysis. Br J Clin
P, Guize L. Pulse pressure: a predictor of long-term cardiovascular
Pharmacol. 2001;51:507–522.
mortality in a french male population. Hypertension. 1997;30:
24. O’Rourke MF, Pauca AL. Augmentation of the aortic and central arterial
pressure waveform. Blood Press Monit. 2004;9:179 –185.
11. London GM, Blacher J, Pannier B, Guerin AP, Marchais SJ, Safar ME.
25. Blacher J, Guerin AP, Pannier B, Marchais SJ, Safar ME, London GM.
Arterial wave reflections and survival in end-stage renal failure. Hyper-
Impact of Aortic Stiffness on Survival in End-Stage Renal Disease. tension. 2001;38:434 – 438. Circulation. 1999;99:2434 –2439.
12. Grauholt AM, Grande P, Horby-Petersen J, Jensen J, Rostgaard M,
26. Blacher J, Pannier B, Guerin AP, Marchais SJ, Safar ME, London GM.
Meinertz H. High-density lipoprotein cholesterol assay by magnesium
Carotid Arterial Stiffness as a Predictor of Cardiovascularand All-CauseMortality in End-Stage Renal Disease. Hypertension. 1998;32:570 –574.
dextransulphate precipitation. Scand J Clin Lab Invest. 1986;46:715–721.
27. Boutouyrie P, Tropeano AI, Asmar R, Gautier I, Benetos A, Lacolley P,
13. Oliver JJ, Webb DJ. Noninvasive Assessment of Arterial Stiffness and
Laurent S. Aortic stiffness is an independent predictor of all-cause and
Risk of Atherosclerotic Events. Arterioscler Thromb Vasc Biol. 2003;23:
cardiovascular mortality in hypertensive patients. Hypertension. 2001;37:
14. Lantelme P, Mestre C, Lievre M, Gressard A, Milon H. Heart rate: an
28. Laurent S, Katsahian S, Fassot C, Tropeano AI, Gautier I, Laloux B,
important confounder of pulse wave velocity assessment. Hypertension.
Boutouyrie P. Aortic stiffness is an independent predictor of fatal stroke
in essential hypertension. Stroke. 2003;34:1203–1206.
15. Hayward CS, Avolio AP, O’Rourke MF, Lantelme P, Mestre C, Lievre
29. Boutouyrie P, Tropeano AI, Asmar R, Gautier I, Benetos A, Lacolley P,
M, Gressard A, Milon H. Arterial pulse wave velocity and heart rate.
Laurent S. Aortic Stiffness Is an Independent Predictor of Primary
Hypertension. 2002;40:8e–9e.
Coronary Events in Hypertensive Patients: A Longitudinal Study. Hyper-
16. Wilkinson IB, MacCallum H, Flint L, Cockcroft JR, Newby DE, Webb
DJ. The influence of heart rate on augmentation index and central arterial
30. Cruickshank K, Riste L, Anderson SG, Wright JS, Dunn G, Gosling RG.
pressure in humans. J Physiol. 2000;525:263–270.
Aortic pulse-wave velocity and its relationship to mortality in diabetes
17. Kelly RP, Millasseau SC, Ritter JM, Chowienczyk PJ. Vasoactive drugs
and glucose intolerance: an integrated index of vascular function? Cir-
influence aortic augmentation index independently of pulse-wave
culation. 2002;106:2085–2090.
velocity in healthy men. Hypertension. 2001;37:1429 –1433.
31. Meaume S, Benetos A, Henry OF, Rudnichi A, Safar ME. Aortic Pulse
18. Wilkinson IB, Qasem A, McEniery CM, Webb DJ, Avolio AP, Cockcroft
Wave Velocity Predicts Cardiovascular Mortality in Subjects Ͼ70 Years
JR. Nitric oxide regulates local arterial distensibility in vivo. Circulation.
of Age. Arterioscler Thromb Vasc Biol. 2001;21:2046 –2050.
32. Grey E, Bratteli C, Glasser SP, Alinder C, Finkelstein SM, Lindgren BR,
19. Stewart AD, Millasseau SC, Kearney MT, Ritter JM, Chowienczyk PJ.
Cohn JN. Reduced small artery but not large artery elasticity is an
Effects of inhibition of basal nitric oxide synthesis on carotid-femoral
independent risk marker for cardiovascular events. Am J Hypertens. 2003;16:265–269.
pulse wave velocity and augmentation index in humans. Hypertension.
33. Cohn JN, Quyyumi AA, Hollenberg NK, Jamerson KA. Surrogate
markers for cardiovascular disease: functional markers. Circulation 2004;
20. Bogren HG, Mohiaddin RH, Klipstein RK, Firmin DN, Underwood RS,
Rees SR, Longmore DB. The function of the aorta in ischemic heart
34. Smulyan H, Siddiqui DS, Carlson RJ, London GM, Safar ME. Clinical
disease: a magnetic resonance and angiographic study of aortic com-
utility of aortic pulses and pressures calculated from applanated radial-
pliance and blood flow patterns. Am Heart J. 1989;118:234 –247.
artery pulses. Hypertension. 2003;42:150 –155.
21. Ohtsuka S, Kakihana M, Watanabe H, Sugishita Y. Chronically decreased
35. Nichols, W. W., and M. F. O’Rourke. McDonald’s Blood Flow in
aortic distensibility causes deterioration of coronary perfusion during
Arteries. Philadelphia, PA: Lea and Febiger; 1990:147.
increased left ventricular contraction. J Am Coll Cardiol. 1994;24:
36. Somes GW, Pahor M, Shorr Rim Cushman WC; Applegate WB: The role
of diastolic blood pressure when treating isolated systolic hypertension.
22. Kingwell BA, Waddell TK, Medley TL, Cameron JD, Dart AM. Large
Arch Int Med 1999;159, 17:2004 –2009.
artery stiffness predicts ischemic threshold in patients with coronary
37. Messerli FH, Kupfer S, Pepine CJ. J curve in hypertension and coronary
artery disease. J Am Coll Cardiol. 2002;40:773–779.
artery disease. Am J Cardiol. 2005;95:160.
A Look at the Statistical Issues of Methylation Data AnalysisAlternative Network Interface Development for Smart Grid TechnologyAlternative Web Organizational Design Through Use of TabsAmiloride Inhibition of Store-Operated Calcium EntryAnalysis of IQG1 Phosphorylation Mutants in the Action ProbeAnalysis of the Metabolism of Lactic Acid through Mitochondrial Function by the Method of High-Performa
TOBACCO USE AND IMPOTENCE If you smoke, you’re playing Russian roulette with your sexual function. Dr. John Mulhall, Director, Center for Sexual Health, Loyola University Medical Center There’s absolutely no question about it. It causes it very commonly. Dr. Culley Carson, Urology Department Chairman, University of North Carolina If you smoke, you’re about twice as likel
 Chirinos et al
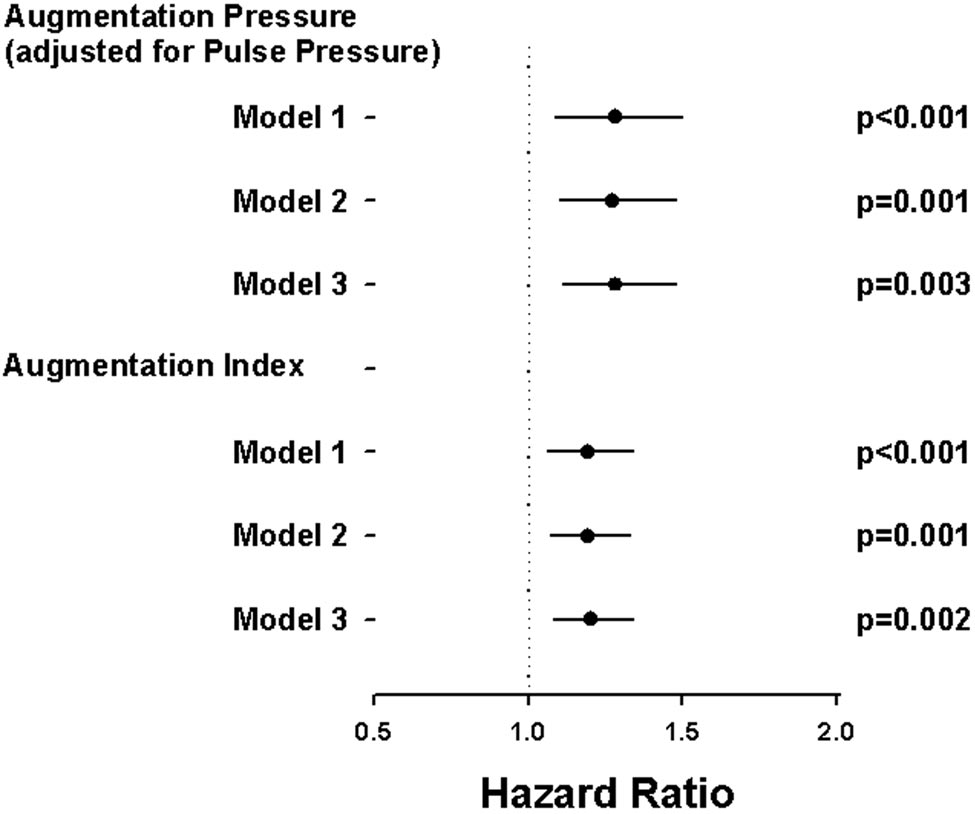 982
982