Press Advisory July 9, 2009 For immediate release Press contacts: Eric Lerner 908-898-1048 elerner@lawrencevilleplasmaphysics.com Richard Lieu 256-226-7225 richardlieuuah@gmail.com Growing mass of evidence challenges “concordance cosmology” but elicits no response. Why the Silence?
In the past year, but particularly in the past three months, a growing number of astrophysical papers have revealed results that challenge the “precision cosmology” notion in fundamental ways. These papers have undermined nearly all the claimed observational confirmation of the dominant cosmological model. They have shown important errors in the WMAP team’s analysis of the data on the cosmic background radiation (CBR) which call into question the entire conclusions based on this analysis. They have demonstrated that the predictions of Big Bang nucleosynthesis for the abundance of lithium are erroneous and that the discrepancy is getting larger with better data. They have discovered the existence of ever-larger structures in the universe, structures far larger than those allowed for in the “concordance cosmology.” They have shown that the size and surface brightness of distant galaxies are in sharp contradiction with the predictions of any expanding universe model and are closer to those predicted for a non-expanding universe. In each of these fields of research, the evidence is reinforced by several different recent papers, by unrelated teams of researchers. If the concordance model was encountering problems in one area, while recording triumphs in others, it might be understandable for leading cosmologists to dismiss a few results as anomalies not worthy of much attention. But the recent papers have undermined not one but virtually all of the pieces of evidence used to justify the claim that modern cosmology has it “precisely” right. In this circumstance, it would be reasonable to expect that the defenders of the concordance cosmology would reply to at least some of these papers. In fact, the response has been silence. The following report summarizes and points to the importance of some the key papers of the last three months, referring as needed to supporting papers from the past year. 1) WMAP team analysis errors
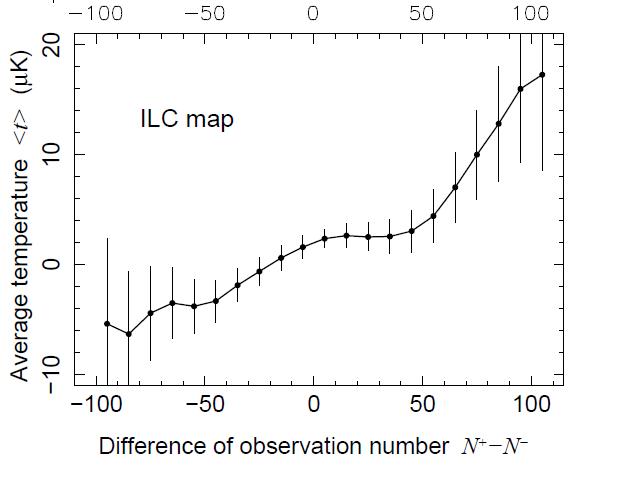
In May, Ti-Pei Li et al posted to arXiv a paper showing serious errors in the WMAP team’s analysis of the satellite’s data. The analysis and the resulting maps of the CBR have been used by the WMAP team and others to argue that the WMAP data spectacularly confirms the predictions of the six-parameter LCDM (dark matter, dark energy) model of the universe. However, the new paper, “Observation number correlation in WMAP data” by Ti-Pei Li et al, arXiv 0905.0075, which has been accepted by MNRAS, shows that a spurious apparent temperature is introduced into the map of the CBR by the WMAP team’s analyses. As a result, the conclusions based on this analysis are thrown into doubt. Dr. Li is a member of the Chinese Academy of Science. WMAP mapped the tiny variations of anisotropies in the CBR by comparing the inputs of two receivers or horns spaced 141 degrees apart, as the satellite spun and scanned the entire sky. Complex mathematical procedures were used to transform these differences in inputs into map of absolute temperature or intensities at every point in the sky. But the authors show that when the number of observations of a given pixel by the “plus” horn (the number of times that point in the sky is scanned) is different than the number of observations
by the “minus” horn, there is a spurious temperature added. As a result there is clear correlation between the temperature in the WMAP team’s maps and the number of times a given pixel is observed, clear evidence of an induced error in the analysis. This paper is a follow-up to Liu and Li’s earlier paper on the same subject, arXiv0806.4493. In that earlier paper, the authors showed that there were additional errors in the WMAP team maps: they showed that pixels that were 141 degrees away from the 2000 hottest pixels in the map are on average 12-14 microkelvin cooler than average pixels. This is several hundred times the expected random variation.
Li et al’s figure shows a clear correlation between the temperature calculated by the WMAP team and the difference in the number of times a pixel is observed by the satellite’s two antennae. So, from these papers, it seems that there are spurious temperature anisotropies that are comparable with the entire anisotropy found in the WMAP team’s maps. Therefore the entire analysis of cosmological parameters based on these maps is of questionable value. Indeed it seems very puzzling that an analysis that is so contaminated with errors should come up with parameters anywhere near those expected by LCDM models. Many other recent papers have demonstrated results that could be explained by these errors in the maps. For example, in April Bi-Zhu Jiang, Richard Lieu, and Shuang-Nan Zhang showed (“Spectral variation of the WMAP 5-year degree scale anisotropy”, arXiv:0904.2513) that the first acoustic peak in WMAP maps did not have a black-body spectrum and was asymmetrical—different in the Northern and Southern hemispheres. Such behavior could, potentially, be explained in part by the errors in the maps that Li and colleagues have pointed out, which vary from one wave-band to the next and are also asymmetrical, resulting from the scanning pattern of the WMAP satellite. Similarly in January, J. M.Diego et al showed that the WMAP team’s map had a ridge running along the ecliptic, the plane of the earth’s orbit around the sun, which again might be due to the errors in data reduction. (“WMAP anomalous signal in the ecliptic plane”, arXiv: 0901.4344) 2) Lithium observations contradict BBN
It has long been known that the Big Bang predictions for the abundance of lithium are about three times larger than levels observed in metal-poor dwarf stars, which formed early in the history of our galaxy. But this problem has recently been becoming worse, as more and more-metal poor dwarfs are discovered, with still
lower levels of lithium. In April, Wako Aoki et al (“Lithium Abundances of Extremely Metal-Poor Turn-off Stars”, ApJ 698 1803-1812, arXiv 0904.1448) analyzed a set of dwarf stars with iron abundances between 1,000 and 10,000 times lower than that of the sun, which are presumably more pristine than dwarfs with more iron. They found a downward trend in lithium abundance, with the most iron-poor stars having lithium abundances a factor of five below BBN predictions. This downwards slope is in sharp contradiction to the conventional prediction that lithium was produced by the Big Bang, but is consistent with theories which hypothesize that lithium was produced by cosmic rays from stars in the early galaxy. Last year, in confirmation of this downward trend, Anna Frebel et al, found that the most metal-poor star yet discovered, with iron abundance 100,000 times less than the sun’s, had no observable lithium, with an upper limit on the abundance one hundred times less than BBN predictions (“HE 1327-2326, an Unevolved Star with [Fe/H]<-5.0. II. New 3D-1D Corrected Abundances from a Very Large Telescope UVES Spectrum” ApJ, 684, pp. 588-602. ArXiv 0805.3341)
Aoki et al found a decline in lithium abundance with decreasing iron abundance, as shown in this log-log plot. The horizontal line at the top of the figure (added by ACG editors) shows the level predicted by Big Bang Nucleosynthesis theory.
Large Scale Structures are too big
It has long been clear that large scale structures are too big to have formed in the conventional cosmological model. Recent papers using large surveys have confirmed this picture. For example, Francesco Sylos Labini, Nikolay L. Vasilyev and Yurij V. Baryshev (“Persistent fluctuations in the distribution of galaxies from the two degree Field Galaxy Redshift Survey” EPL 85 29002) showed that there is no evidence of a homogenous distribution of galaxies even on scales as large as 75 Mpc, while predictions based on conventional cosmological models predict a convergence to homogeneity on scales of 10 Mpc. More dramatically, N.V. Nabokov and Baryshev showed (“A search for super-large structures in deep galaxy surveys” arxiv0809.2390) that there is evidence of ultra-large- scale structure on scale of 1000 Mpc that shows up in galaxy surveys such as the Hubble Ultra Deep Field and in the redshift distribution of gamma-ray bursters. Such huge structures are very considerable challenges to the dominant cosmological model, which assumes the universe originated from a homogenous state 14 billion years ago.
Surface brightness and size predictions are contradicted One of the most dramatic predictions of the dominant expanding universe model is that the surface brightness of objects decreases sharply at high redshift and their apparent size increase, while in a non-expanding universe, the surface brightness of objects is constant with distance and apparent size is inversely proportional to distance. Recent papers have indicated a growing contradiction between this basic expanding-universe prediction and observations. In June, Eric Lerner posted results of an extensive study of the surface brightness of disk galaxies, comparing high redshift galaxies observed by Hubble with low-redshift galaxies observed by GALEX (“Tolman Test from z = 0.1 to z = 5.5: Preliminary results challenge the expanding universe model”, arXiv:0906.4284). He found that surface brightness was indeed close to constant and the data was a much better fit to the non-expanding prediction, with redshift proportional to z at all redshifts, than to the LCDM model, even with the generally accepted model for size evolution of galaxies. Also remarkably, the paper points out that the luminosity predictions of the simple non-expanding model are almost indistinguishable from those of the LCDM model. Lerner’s findings were apparently deemed so unacceptable by arXiv moderators, that the paper was excluded from the astrophysics section, even though other papers on the same subject have been posted there. A few days after Lerner’s posting, Rik Williams et al posted an extensive survey on galaxy size that added to the contradictions with the conventional model (“The Evolving relations between Size, Mass, Surface density and Star Formation in 3x10⁴ galaxies since z=2”,arXiv 0906.4786). As had several earlier, less extensive surveys, they found that, given conventional formulae relating apparent to physical size, the most massive galaxies at high redshift were much smaller and denser than any similar massive galaxies existing today. This produces a paradox, since there is no known mechanism than can cause galaxies to greatly expand without losing mass. Yet the apparently ultra-small galaxies were the same mass as the most massive galaxies existing today. Where did the ultra-dense massive galaxies, which would also be the most massive in today’s universe, go? A possible solution to this paradox is that the expanding-universe formulae greatly underestimate the physical size of galaxies at high redshift. If the same data is analyzed assuming non-expansion, the galaxies at high redshift are essentially the same size as those at low redshift. The summary presented here is by no means exhaustive and other contradictions between the concordance cosmology and observation exist. But this is sufficient to raise the question—why the silence? The ACG is an open society of scientists from all over the world, dedicated to the advance of cosmology. (www.cosmology.info)
Reprinted from: , January 2006 The Good Man at the NIH) Dr. Jonathan Fishbein's Fight for Medical Ethics in AIDS Medicine In December 2005, I spoke with NIH whistleblower Dr. Jonathan Fishbein. In an exclusive interview, Fishbein discussed the controversial African AIDS drug trials he exposed, his firing and reinstatement and how medical ethics and the public trust are violated when profit
Pizokel Cup 2013 4.STERN A (JUENGERE) FREE SKATING JUDGES DETAILS PER SKATER Program Component Deductions Score (factored) Elodie ROZJIN # Executed Scores of Elements Info Value Program Components Judges Total Program Component Score (factored) Deductions Program Component Deductions Score (factored) Lidia ZUGNONI # Executed Scores of
 by the “minus” horn, there is a spurious temperature added. As a result there is clear correlation between the temperature in the WMAP team’s maps and the number of times a given pixel is observed, clear evidence of an induced error in the analysis. This paper is a follow-up to Liu and Li’s earlier paper on the same subject, arXiv0806.4493. In that earlier paper, the authors showed that there were additional errors in the WMAP team maps: they showed that pixels that were 141 degrees away from the 2000 hottest pixels in the map are on average 12-14 microkelvin cooler than average pixels. This is several hundred times the expected random variation.
Li et al’s figure shows a clear correlation between the temperature calculated by the WMAP team and the
by the “minus” horn, there is a spurious temperature added. As a result there is clear correlation between the temperature in the WMAP team’s maps and the number of times a given pixel is observed, clear evidence of an induced error in the analysis. This paper is a follow-up to Liu and Li’s earlier paper on the same subject, arXiv0806.4493. In that earlier paper, the authors showed that there were additional errors in the WMAP team maps: they showed that pixels that were 141 degrees away from the 2000 hottest pixels in the map are on average 12-14 microkelvin cooler than average pixels. This is several hundred times the expected random variation.
Li et al’s figure shows a clear correlation between the temperature calculated by the WMAP team and the 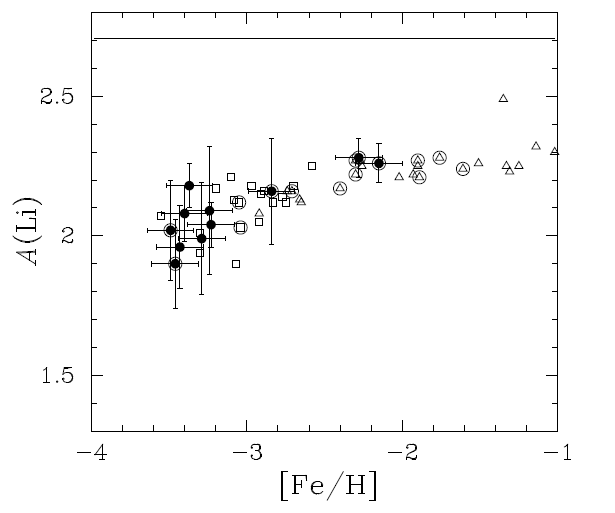 lower levels of lithium. In April, Wako Aoki et al (“Lithium Abundances of Extremely Metal-Poor Turn-off Stars”, ApJ 698 1803-1812, arXiv 0904.1448) analyzed a set of dwarf stars with iron abundances between 1,000 and 10,000 times lower than that of the sun, which are presumably more pristine than dwarfs with more iron. They found a downward trend in lithium abundance, with the most iron-poor stars having lithium abundances a factor of five below BBN predictions. This downwards slope is in sharp contradiction to the conventional prediction that lithium was produced by the Big Bang, but is consistent with theories which hypothesize that lithium was produced by cosmic rays from stars in the early galaxy. Last year, in confirmation of this downward trend, Anna Frebel et al, found that the most metal-poor star yet discovered, with iron abundance 100,000 times less than the sun’s, had no observable lithium, with an upper limit on the abundance one hundred times less than BBN predictions (“HE 1327-2326, an Unevolved Star with [Fe/H]<-5.0. II. New 3D-1D Corrected Abundances from a Very Large Telescope UVES Spectrum” ApJ, 684, pp. 588-602. ArXiv 0805.3341)
Aoki et al found a decline in lithium abundance with decreasing iron abundance, as shown in this log-log plot.
lower levels of lithium. In April, Wako Aoki et al (“Lithium Abundances of Extremely Metal-Poor Turn-off Stars”, ApJ 698 1803-1812, arXiv 0904.1448) analyzed a set of dwarf stars with iron abundances between 1,000 and 10,000 times lower than that of the sun, which are presumably more pristine than dwarfs with more iron. They found a downward trend in lithium abundance, with the most iron-poor stars having lithium abundances a factor of five below BBN predictions. This downwards slope is in sharp contradiction to the conventional prediction that lithium was produced by the Big Bang, but is consistent with theories which hypothesize that lithium was produced by cosmic rays from stars in the early galaxy. Last year, in confirmation of this downward trend, Anna Frebel et al, found that the most metal-poor star yet discovered, with iron abundance 100,000 times less than the sun’s, had no observable lithium, with an upper limit on the abundance one hundred times less than BBN predictions (“HE 1327-2326, an Unevolved Star with [Fe/H]<-5.0. II. New 3D-1D Corrected Abundances from a Very Large Telescope UVES Spectrum” ApJ, 684, pp. 588-602. ArXiv 0805.3341)
Aoki et al found a decline in lithium abundance with decreasing iron abundance, as shown in this log-log plot.